

Utilization of the “Visualization Indicator” (Part 57)
“The Visualization Indicator” utilization (part57)
1. Further develop the “28 Currency Pairs List Indicator” into an indicator
“8 CP Visualization Indicator” to draw EURAUD onEURAUD.
The “8 CP Visualization Indicator” has versions for Oceania, London, New York, and AnyCP. This time, I used the Oceania version.
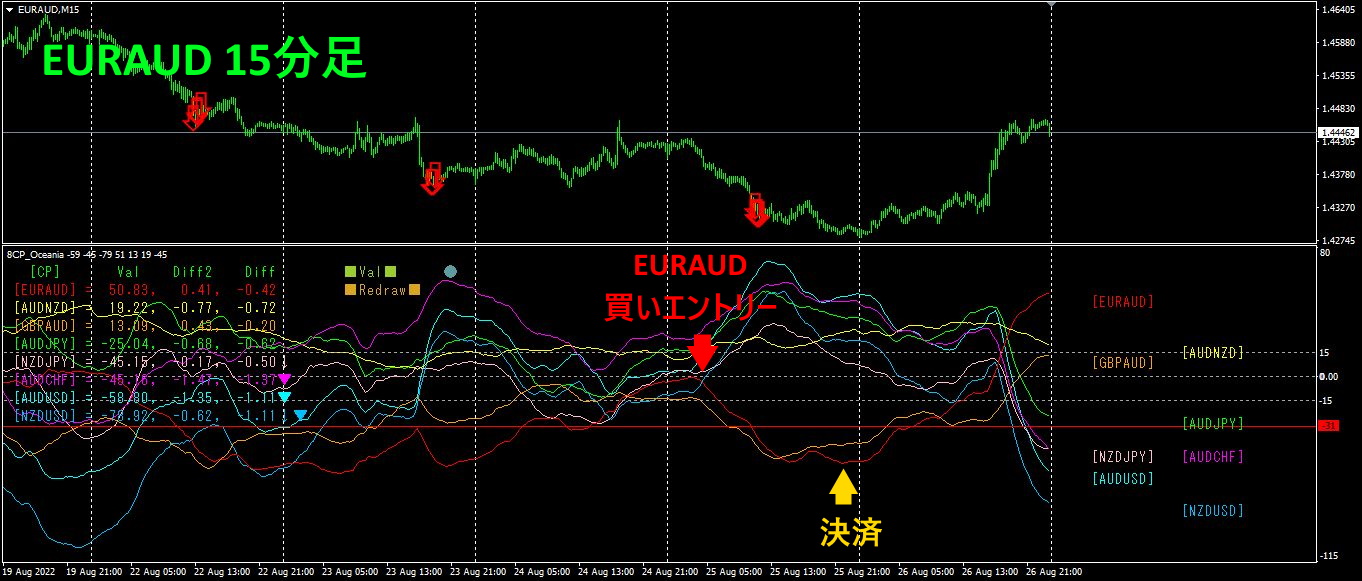
The upper half is the EURAUD 15-minute chart. The red arrows in the upper half indicate the alert positions of the “28 Currency Pairs List Indicator.” The lower half is the “8 CP Visualization Indicator.” The red graph corresponds to EURAUD.
On Thursday, the EURAUD graph of the “8 CP Visualization Indicator” moved below the other graph group. If you had built a sell position here, you would have gained about 110 PIPS of profit. If you had sold from the alert position of the “28 Currency Pairs List Indicator” on Monday, profits would have been even higher.
2. Best SelectTry the indicator
The image below is a screenshot taken onAugust,23, 2022 at23:51.
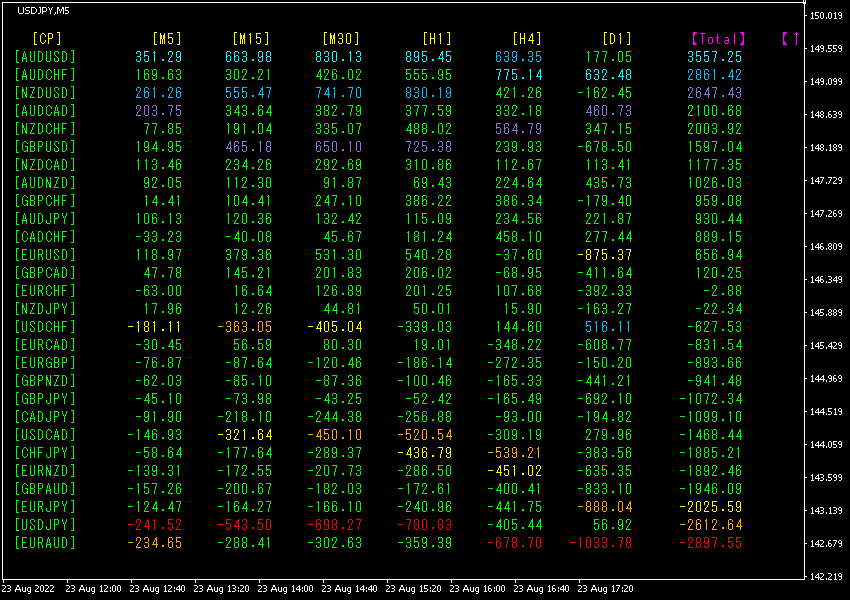
Totalnumbers are sorted in descending order. On the top row, the pairAUDUSDis colored light blue in[M5],[M15],[M30],[H1],[Total], which is light blue. The [H4] and [[D1] also appear in blue tones, suggesting an uptrend in AUDUSD.
Now, let's look at the AUDUSD chart.
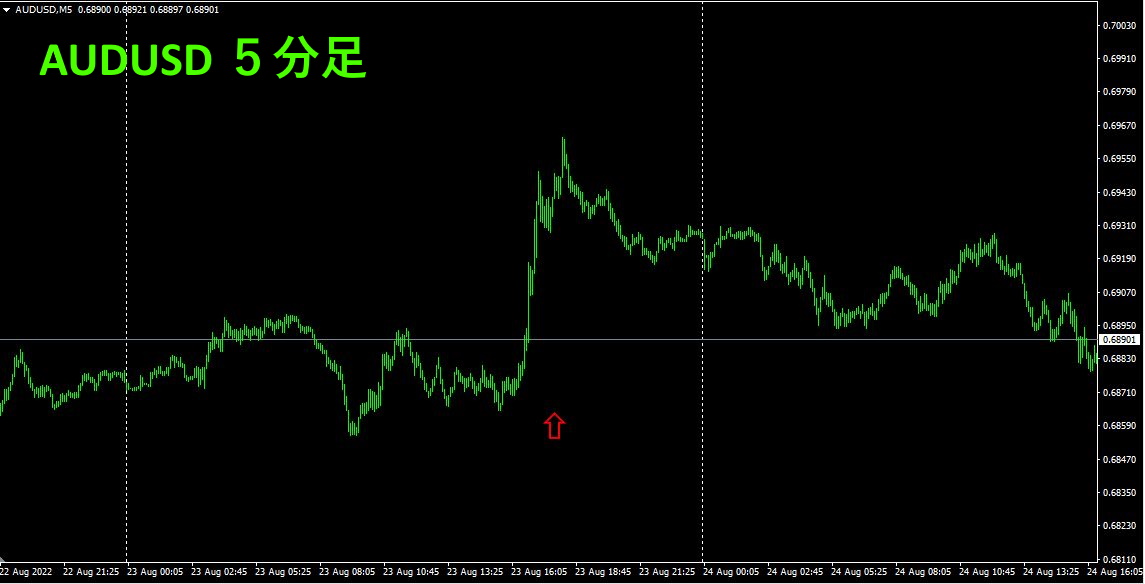
The downward red arrow marks the position where the screenshot was taken. At that point, it was from the latter part of a sharp rise, so it did not yield much profit.
3. What happened to EURJPY, which I have been tracking since May of last year?
Since May, 2021,EURJPY movement is being tracked.
To see the overall trend, I have drawn about30 minutes of the most recent3 weeks.
Last time, I wrote the following.
In terms of currency strength, JPY is higher than EUR, so JPY > EUR. Looking at the slope and direction of the graphs, JPY is moving downward, while EUR is moving slightly upward. As a result, EURJPY is expected to rise.
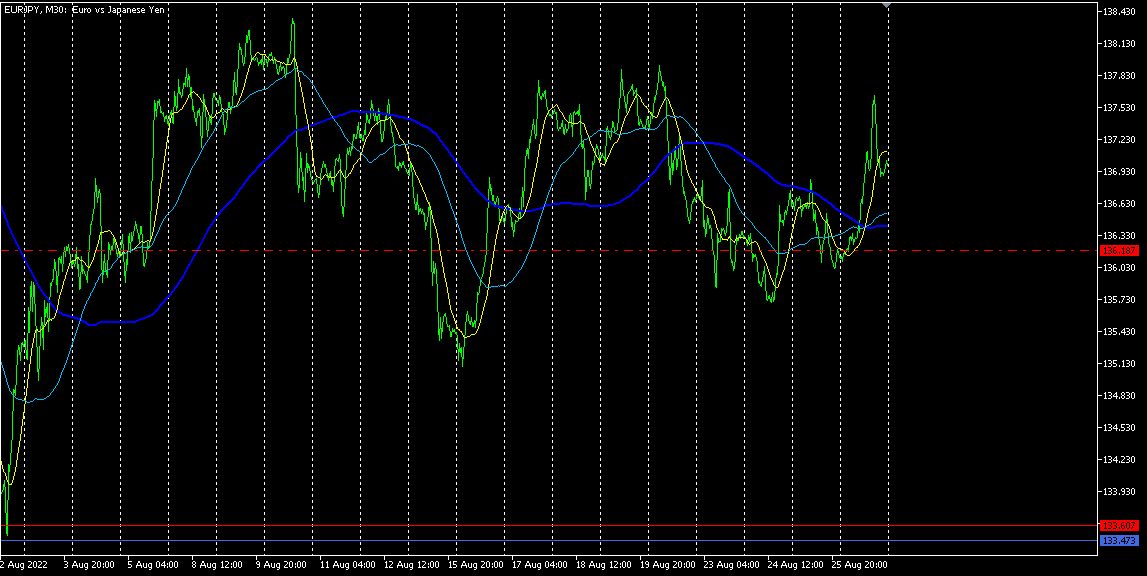
In the first half of the week it declined, and in the second half it rose, but for the week as a whole, it ended slightly lower.
Next, I will refer to the 4-hour currency strength chart.
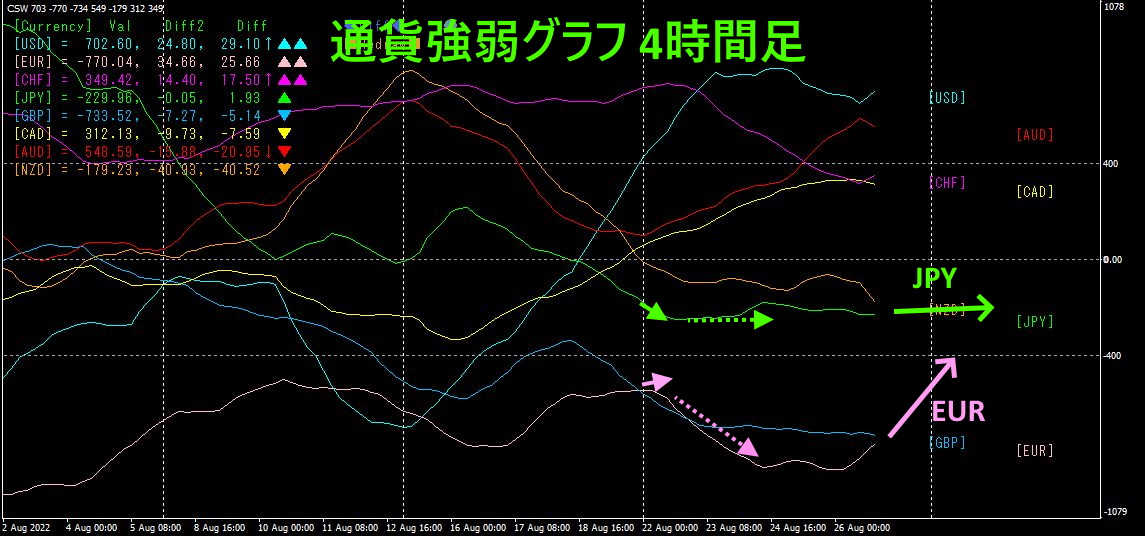
From the currency strength graph, the movement during this period is clear at a glance. I indicated the direction of last weekend and early this week with small arrows. In the first half of the week, JPY was flat, EUR declined, resulting in EURJPY moving lower.
There is no guarantee that the currency strength graph direction will continue in the same way, but as a trend, JPY is flat and EUR is rising, so EURJPY should rise.
If you are interested in the “8C Currency Strength Visualization Indicator,” please refer to the following page.
MT4 version https://www.gogojungle.co.jp/tools/indicators/39150
MT5 version https://www.gogojungle.co.jp/tools/indicators/39159
【My items for sale】


