

Utilization of "Visualization Indicators" (Part 56)
“Visualization Indicator” utilization (part56)”
1. Advance and develop the “28 Currency Pair List Indicator” into an indicator
“8CP Visualization Indicator”to drawGBPUSD.
The “8CP Visualization Indicator” includesOceania edition,London edition,NewYork edition,AnyCP edition. This time, we used theLondon edition.
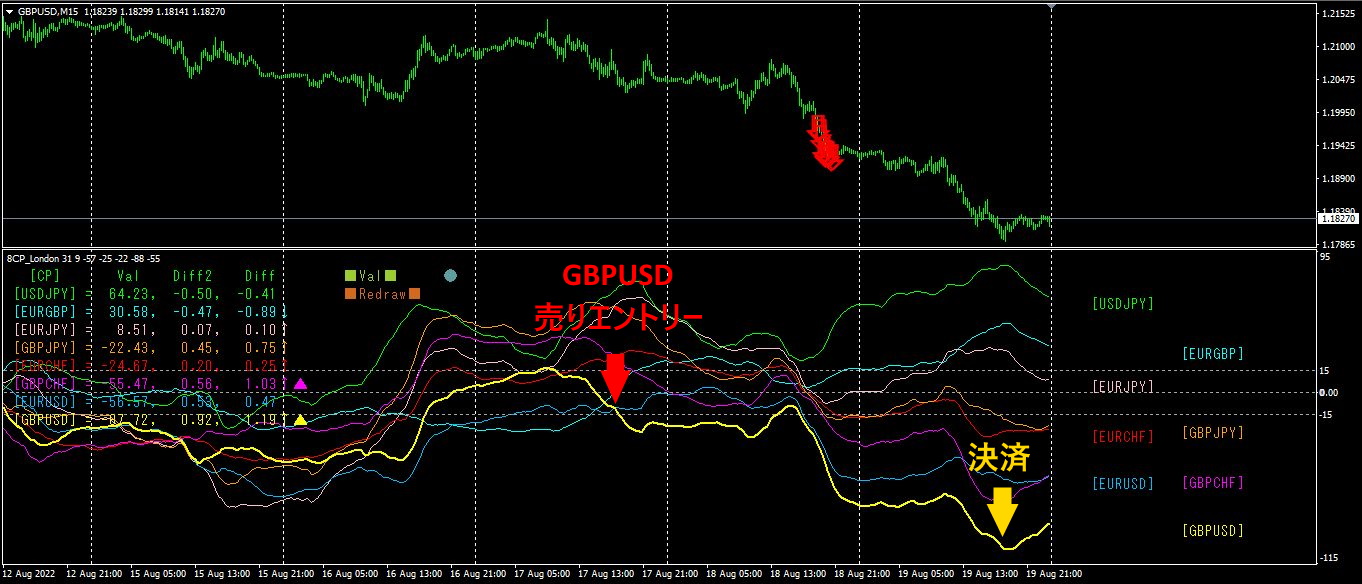
The upper half is theGBPUSD 15-minute chart. The red arrows on the upper half indicate the alert positions of the “28 Currency Pair List Indicator”. The lower half is the “8CP Visualization Indicator”. The yellow bold-line graph corresponds toGBPUSD.
On Wednesday, the GBPUSD graph of the “8CP Visualization Indicator” broke away from the other graphs and reached the lowest position. If you shorted here and held for two days, selling by the weekend would yieldabout250PIPS profit.
2. Best SelectTry the indicator
This week, there were no alerts at all. Naturally, the automated screenshot capture did not operate, so there are no automatic screen captures.
Therefore, I manually took a screenshot on2022 year8 month17 day14:41.
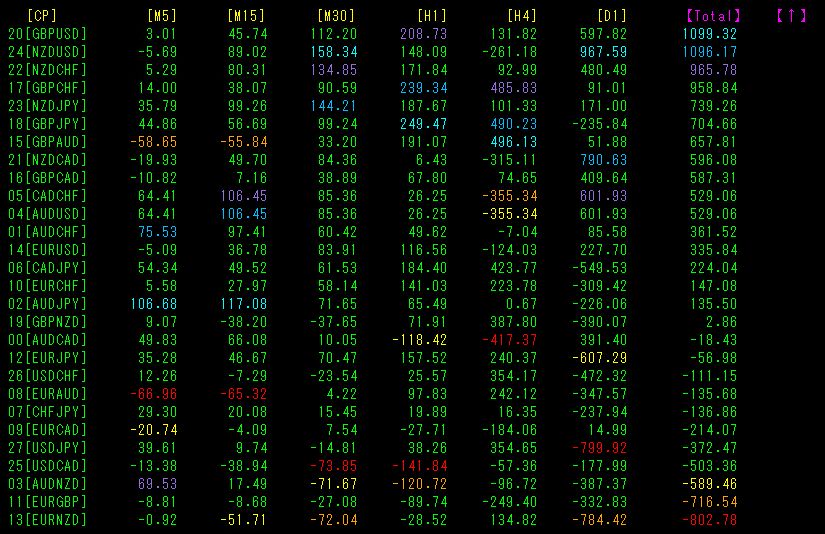
TotalNumbers are sorted in descending order, but the colors of the numbers do not match at all.TotalAbsolute values of the numbers are also small.
We are in a so-called “summer doldrums market,” so not trading is the correct choice.
However, for traders who really want to trade,Best SelectTry evaluating and using the indicatoras an option.
The lower figure is a screenshot taken on2022 year8 month17 day17:07.
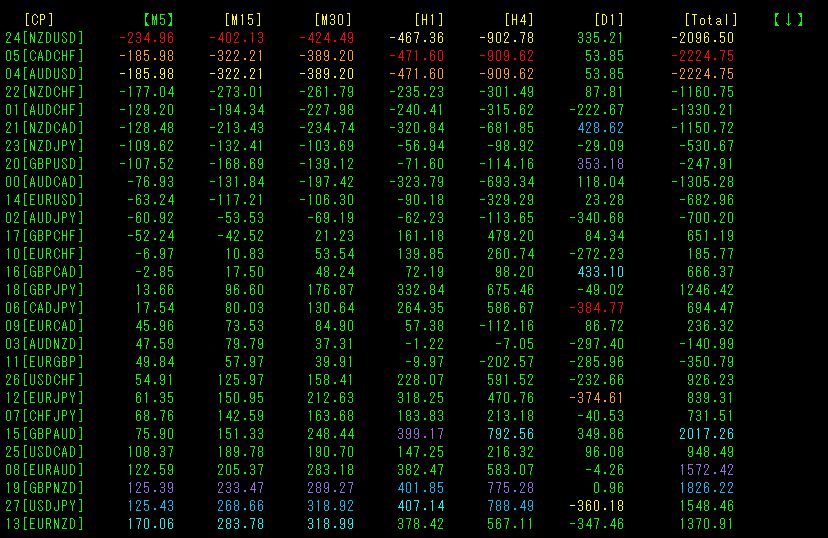
[M5]lowest to highest arranged. Look at the top row’sNZDUSD. is shown in red,[H1] is shown in yellow. is not red, so the alert condition isn’t met. But a short-term 3-candle is shown in red, indicating a potential downtrend for a short term.
So,NZDUSD chart, please.
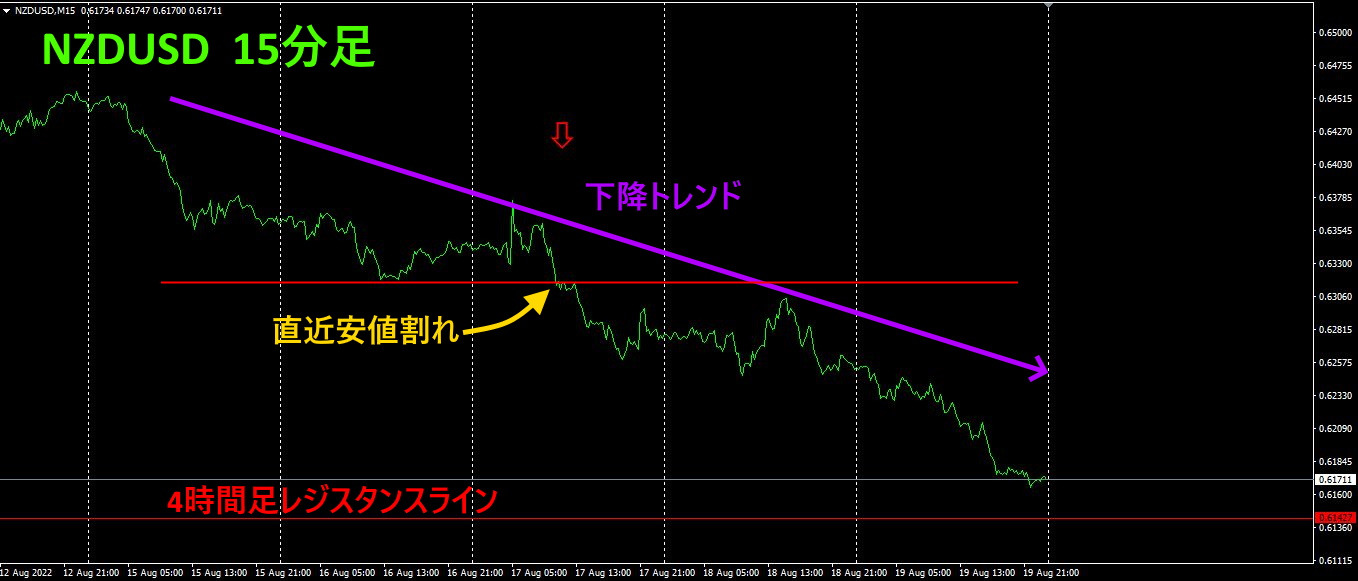
The downward red arrows mark the screenshot locations. Overall, the price is in a downtrend, and coincidentally the screenshot location breaks the most recent low. However, because there is a resistance line drawn on the 4-hour chart nearby, it would be prudent to exit early when profit is realized.
If you short on Wednesday and settle by the weekend, you could gain about150PIPS in profit.
3. Since last May5thEURJPYEURJPY
Since May2021 year5th movements, what happened? movements are being tracked.
To view the overall trend, a30 minute chart of the last approximately3 weeks is drawn.
Previously, it was written as follows.
From Monday to the first half of Wednesday, it advanced. On Wednesday it dipped and seems to be in a ranging state. Chartwise, it appears somewhat weak.
When comparing the slope of EUR andJPY,
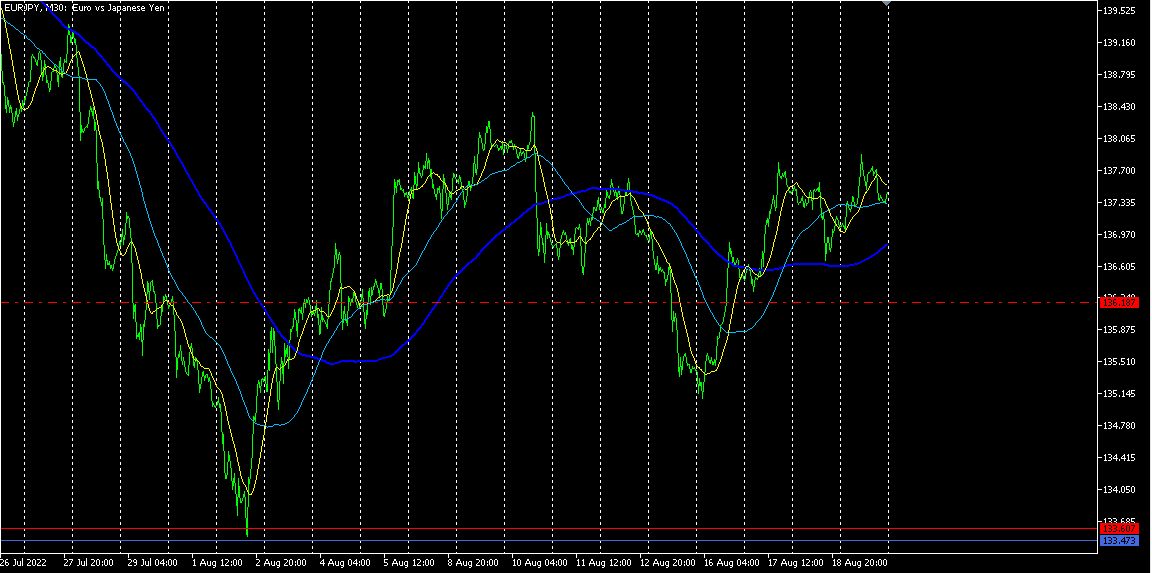
From Monday to early Tuesday, it fell by about180PIPS. Thereafter, it reversed and began to rise.
Next, we refer to the4-hour currency strength chart.
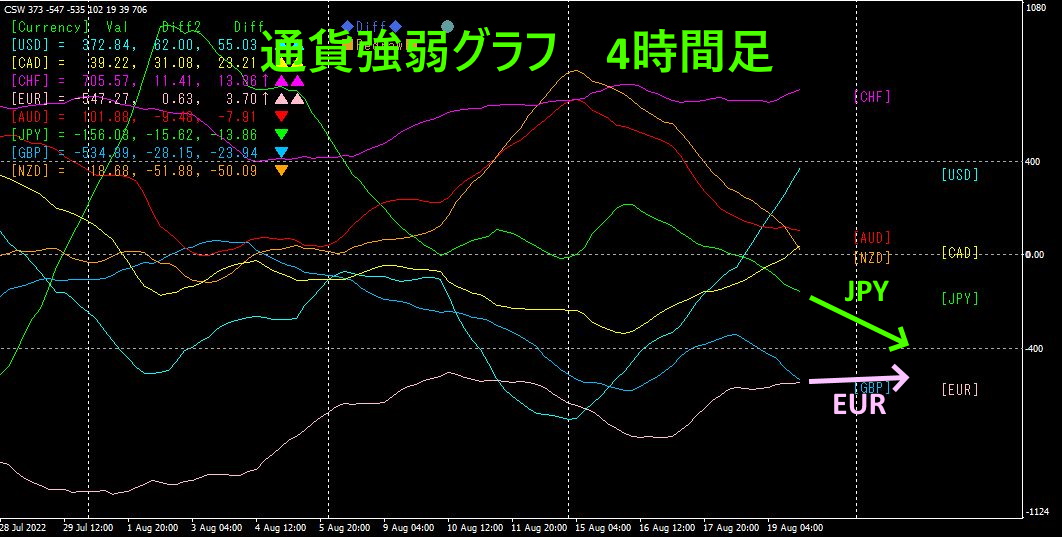
In terms of currency strength,JPY is aboveEUR, soJPY>EUR. Looking at the graph slope and direction,JPY is downward,EUR is slightly upward. Consequently, the EURJPY pair is expected to move higher.
If you are interested in the “8C Currency Strength Visualization Indicator,” please refer to the following page.
MT4 version https://www.gogojungle.co.jp/tools/indicators/39150
MT5 version https://www.gogojungle.co.jp/tools/indicators/39159
【My listed products】


