

Utilization of the "Visualization Indicator" (Part 55)
Utilization of the "Visualization Indicator" (Part 55)55)
1. Further evolve the "28 Currency Pair List Indicator" into an indicator
“8CPVisualization Indicator”to drawNZDUSD
The “8 CP Visualization Indicator” includes the Oceania version, the London version, the New York version, and the AnyCP version. This time, the Oceania version was used.London版、NewYork版、AnyCP版があります。今回は、OceaniaOceania版版を使いました。
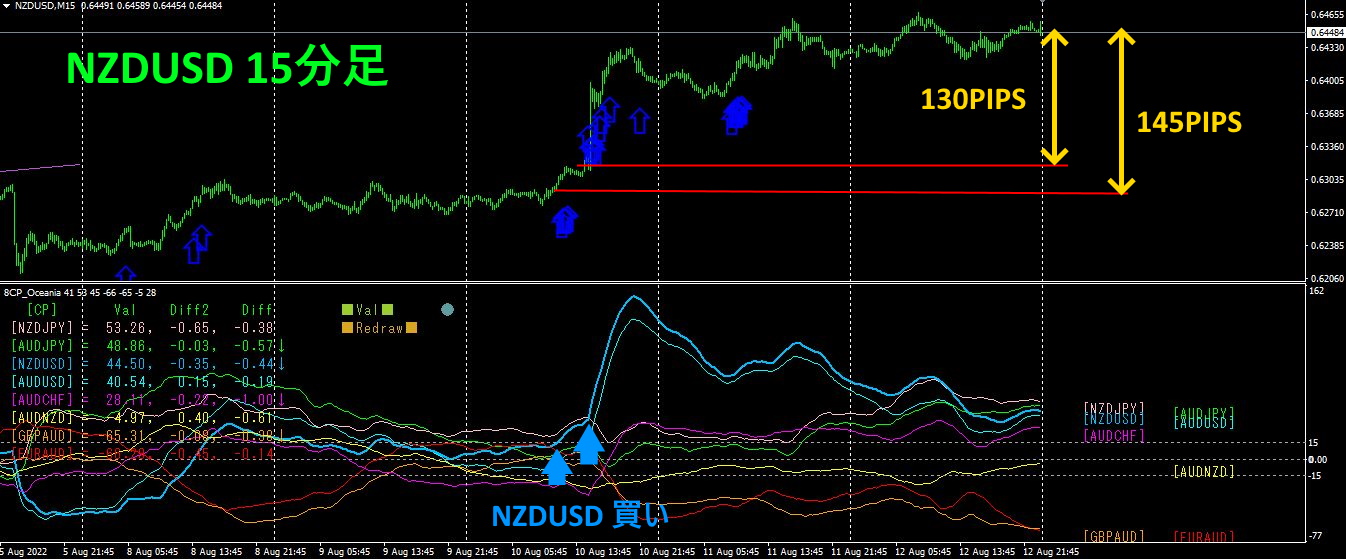
The upper half is the 15-minute chart forNZDUSD. The light blue arrows in the upper half indicate the alert positions of the “28 Currency Pair List Indicator”. The lower half is the “8 CP Visualization Indicator.” The graph with the light blue thick line corresponds toNZDUSD.
If on Wednesday you buy at the point where the threshold is exceeded or where the graph reaches its peak with the “8 CP Visualization Indicator,” you could have earned approximately130PIPS~145PIPS profit by week’s end.
2. Best SelectTry the indicator
The image below was taken on2022 year8 month11 day15:59 (automatic screenshot).
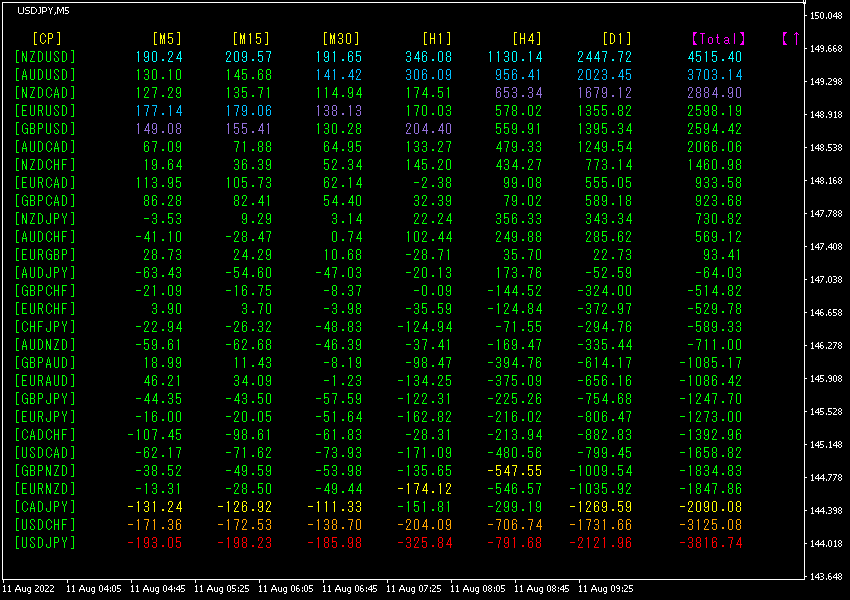
Totalis sorted in descending order by value.
The top row showsNZDUSDwith all numbers in blue, and the bottom row showsUSDJPYwith all numbers in red. Moreover, theTotalvalues are+4515.40and-3816.74 respectively, indicating an uptrend inNZDUSD and a downtrend inUSDJPY. Now, let’s look at the NZDUSD chart. The image below is aNZDUSD 15-minute chart.
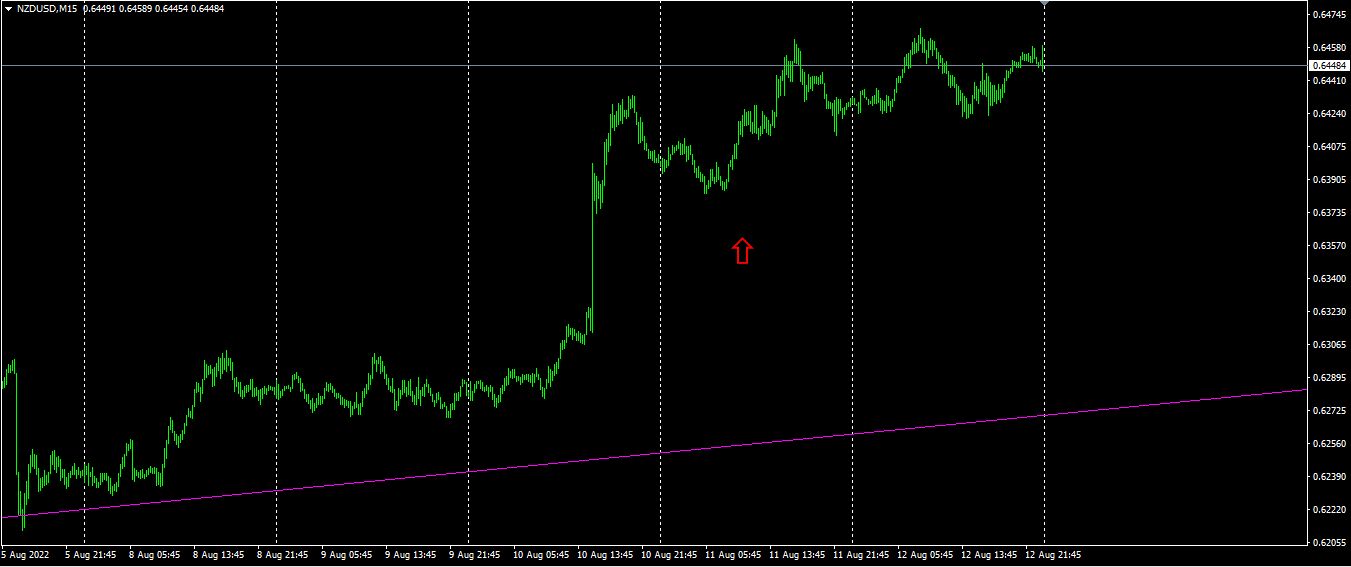
Red arrows indicate automated screenshot capture. The purple rising trend line is drawn on the daily chart. Since it is on a rising trend, buying positions would naturally yield profit.
3. What happened since last May with EURJPY, which we have followed?の動きを追っています。
From May2021 year May we have been tracking
To observe the overall trend, we have drawn roughly three weeks of 30-minute charts.
Previously, I wrote the following.
8月日からが下落し、は上昇しています。結果としては上げということになるわけです。時間足通貨強弱チャートで見る限り、最も強い通貨がで最も弱い通貨がです。両者は拡散から収束に向かっているので、を買えば良いという結論になるわけです。
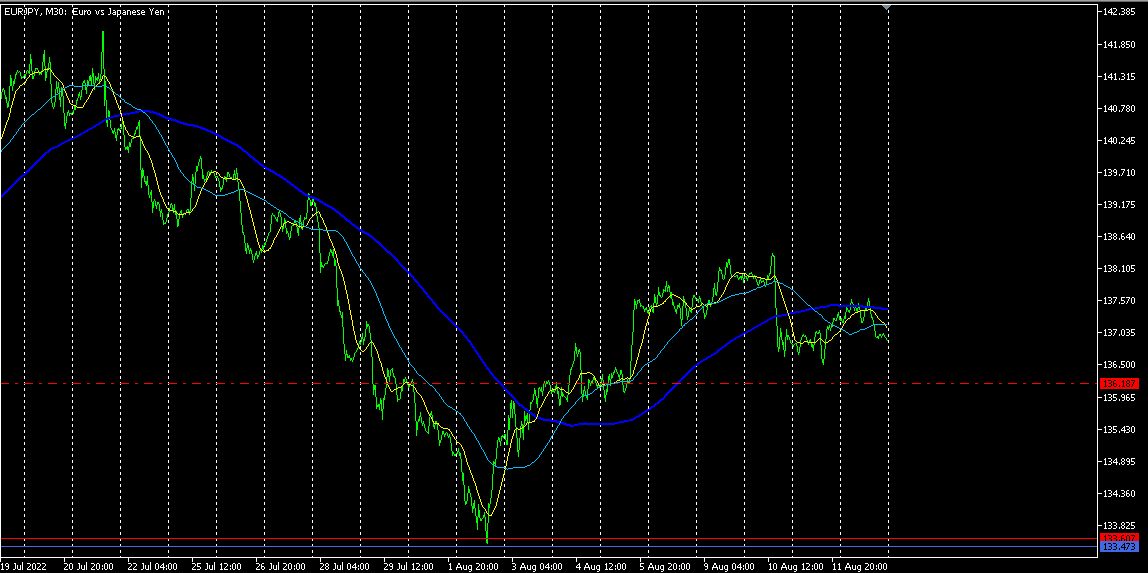
From Monday to the early part of Wednesday, it moved upward. On Wednesday it declined once, and now seems to be in a range-bound state. Chart-wise, it looks slightly weak.
Next, refer to the4hour currency strength chart.
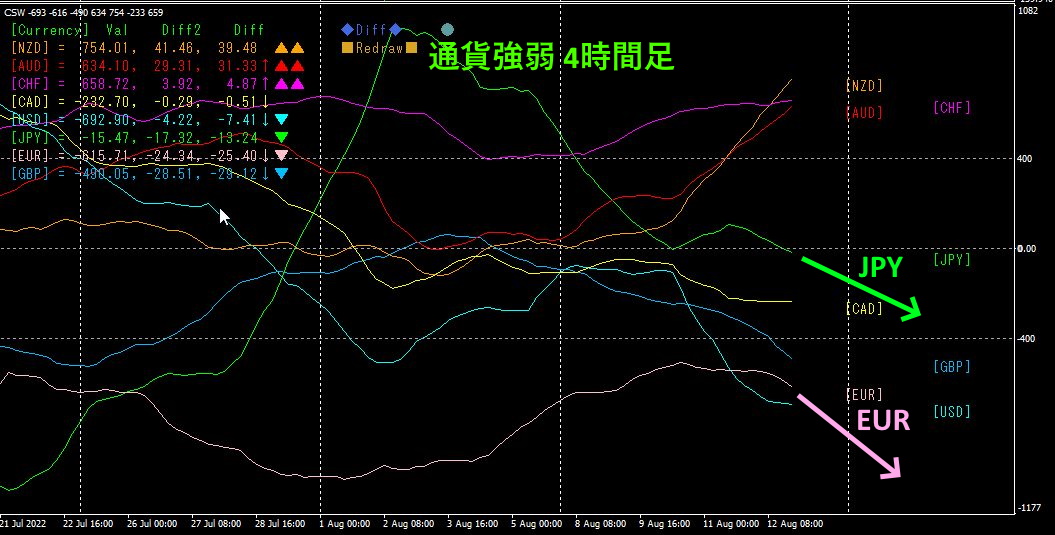
In terms of currency strength,JPYis above, soEUR. Looking at the graph slope and direction,andboth show a slight downward tendency.andslopes indicate thathas a slightly stronger slope. Consequently, EURJPY is expected to move slightly downward.
If you are interested in the “8C Currency Strength Visualization Indicator,” please refer to the following page.
MT4 version https://www.gogojungle.co.jp/tools/indicators/39150
MT5 version https://www.gogojungle.co.jp/tools/indicators/39159
【My listed items】


