

Utilization of the "Visualization Indicator" (Part 54)
“Visualization Indicator” Utilization (Part54)”
1. Further evolve the “28 Currency Pair List Indicator” into an indicator
“8CP Visualization Indicator”to drawAUDJPY.
The “8CP Visualization Indicator” includesOceania version, London version, NewYork AnyCP version. This time, I used the Oceania version.
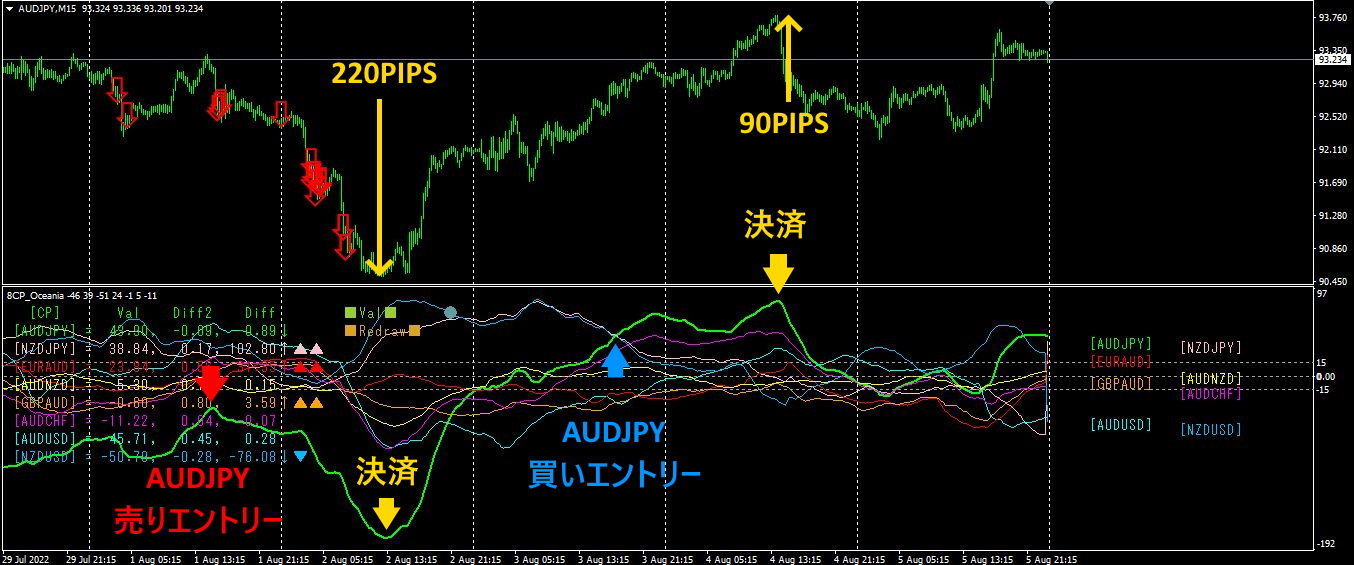
The upper half is theAUDJPY 15-minute chart. The red arrows in the upper half indicate the alert positions of the “28 Currency Pair List Indicator”.CP The lower half is the “8 Visualization Indicator.” The graph with the green bold line corresponds toAUDJPY.
From Monday to Tuesday, if you held a selling position, and from Wednesday to Thursday a buying position, you would have earned approximately About220 PIPS and about90 PIPS (Total310 PIPS).
2. Best SelectTry the indicator
The figure below is a screen capture (automatic screenshot) taken at 19:02 onAugust, 2022, 1, 19:02.
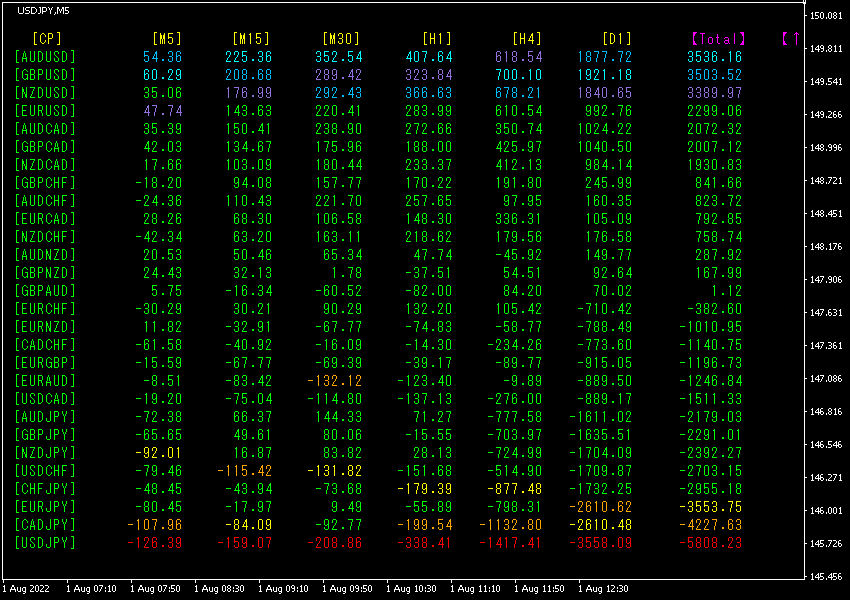
Total values are sorted in descending order.
The bottom row’sUSDJPY shows all numbers in red, and theTotal value is-5808.23, indicating a significant downtrend. Now, let’s look at theUSD chart. The figure below is theUSDJPY 15-minute chart.
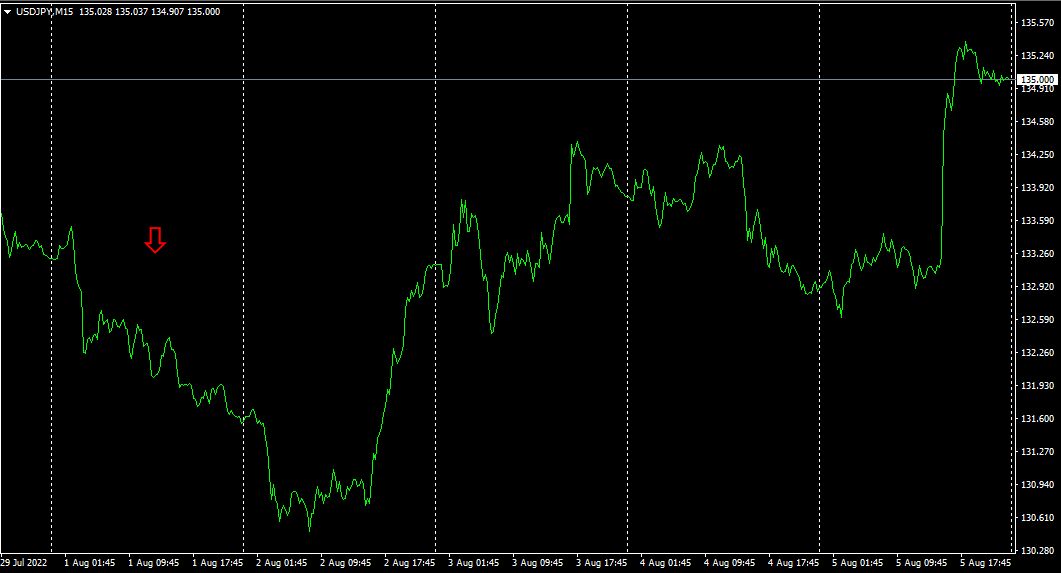
I captured the screenshot with red arrows automatically. It was in the middle of a downward trend; if you held selling positions until the next day, you could have earned about 155PIPS of profit.
3. What happened to EURJPY, which I have been tracking since last yearMay?
Since May, 2021, I have been following EURJPY.
To see the overall trend, I am drawing roughly the last30 minutes of the3 weeks with a 30-minute chart.
Last time I wrote the following.
As before, theUSD is the strongest currency,JPY is the weakest. The direction is thatEUR goes down,JPY goes up. Consequently, in terms of currency strength,EURJPY is expected to move downward.
From the above,EURJPY is thought to continue downward.
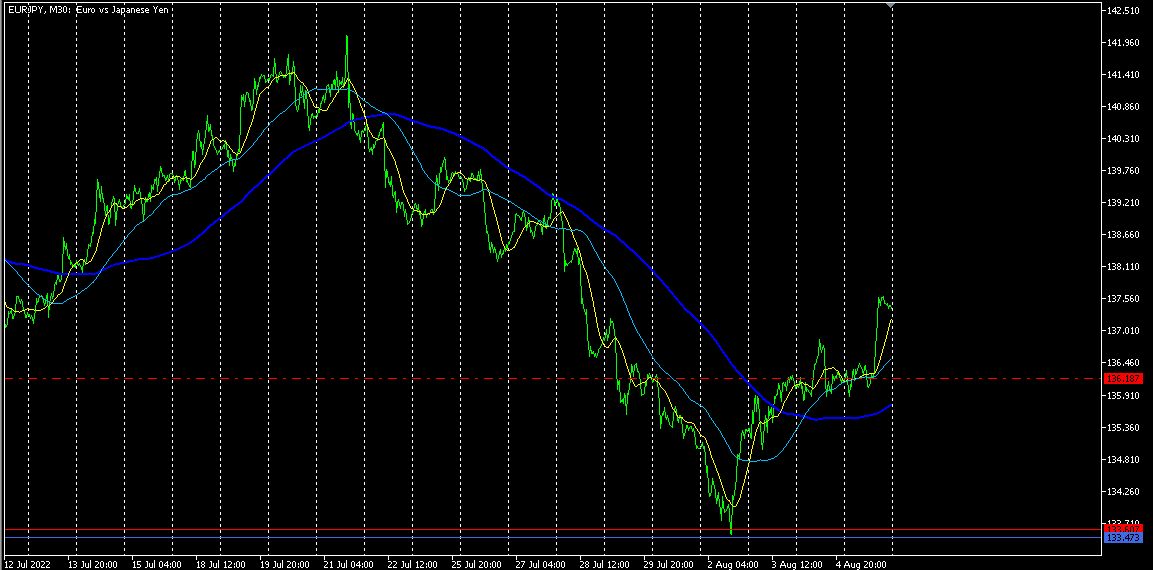
From the currency strength directions,EURJPY was expected to fall. Monday and Tuesday followed that, but subsequently, it reversed and rose. It hit the resistance line on the long-term chart and reversed. This shows that long-term level lines are not to be ignored. Chart-wise, the bias is now upwards.
Previously, I examined with a daily currency strength chart, but this time I will refer to a four-hour currency strength chart. For viewing a week's movement, the four-hour chart may be more appropriate.4 hours per chart
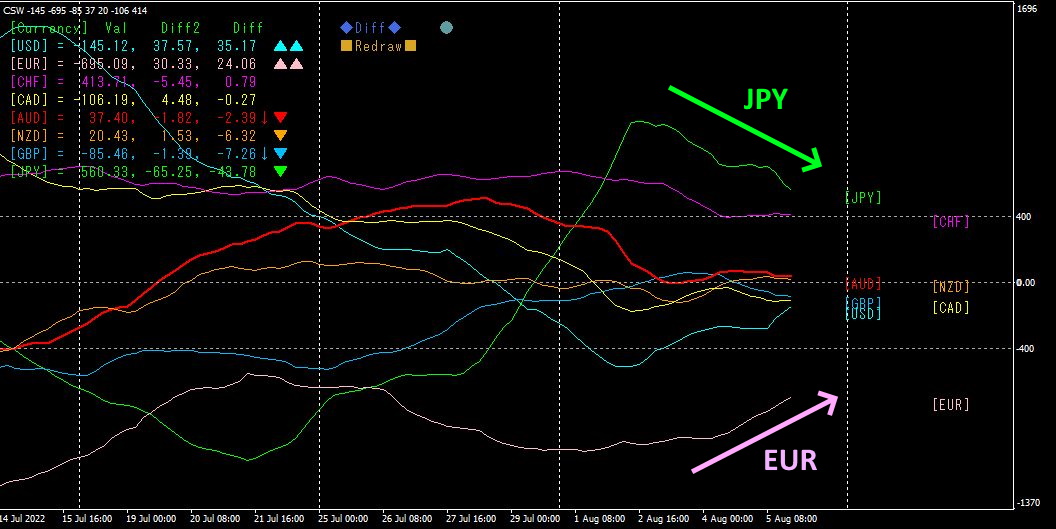
From August 2, has fallen, has risen. As a result, EURJPY has risen.4 time-frame currency strength chart shows the strongest currency asJPY and the weakest asEUR. Since they are diverging and converging, the conclusion is to buyEURJPY.
Since the market changes moment by moment, making a certain forecast is very difficult. The future is nearly impossible to predict. However, looking at the currency strength indicators, now the best options are to buyEURJPY andUSDJPY.
If you are interested in the “8C currency strength visualization indicator,” please refer to the following page.
MT4 version https://www.gogojungle.co.jp/tools/indicators/39150
MT5 version https://www.gogojungle.co.jp/tools/indicators/39159
【Products I have for sale】


