

The USD/JPY has signaled a sell shift right at the start of the year! In the near term, beware of a rebound.
From the sharp drop in US stocks, the Dow, which took the lead, has returned close to its rebound high
It turned into a rebound and settled for a moment last week, but
In the foreign exchange market, especially the dollar-yen, a dollar-selling trend continues, and yen-buying moves have accelerated
At one point it showed a noticeable decline and we began to see the 105 yen level.
It is of interest whether further declines will occur, and in the near term the movement suggests
that the timing of the verdict has possibly arrived, and we analyzed including this possibility.
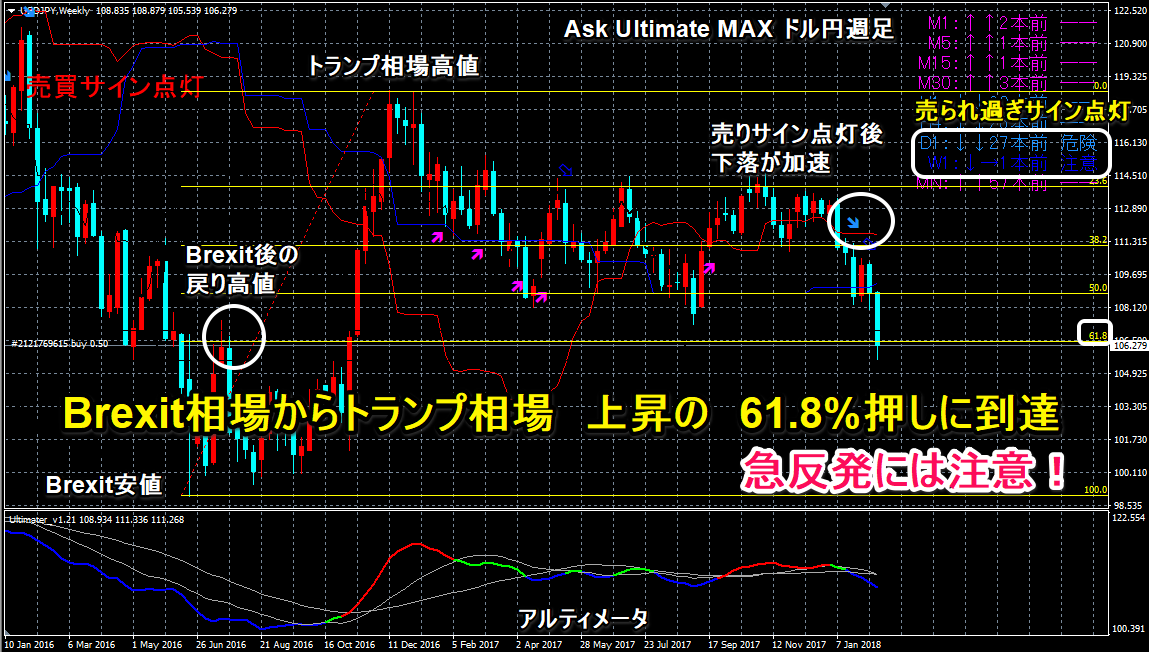
The chart is the Ask Ultimate MAX – USD/JPY weekly, which for the first time in a while has shifted to a selling trend from late January
and the subsequent rebound aimed at the 110 yen level has been followed by a sharp decline.
However, even in this rapid movement, selling reached a certain level, making it an over-sold condition,
and it sat at the 61.8% Fibonacci retracement level from the Brexit era into the Trump era
and reached a point that coincides with the retrace high from the Brexit period, suggesting
that market participants may view this as an important turning point that cannot be ignored.
However, even with a rapid surge, a major turning movement is not expected at this stage, and the 110 yen level
will remain under downward pressure until it can be clearly cleared.
Since the Trump era, the USD/JPY downturn has occurred over a certain period,
so one should be very careful about the timing when such a rule breaks down.
In the US dollar market, the euro-dollar is once again aiming for this year’s high,
and in the Ask Ultimate MAX, it has again shown an overbought signal
which has lit up repeatedly since last year, but thereafter the move has stalled,
and last week it stalled markedly from the 1.25 range.
With the Nikkei Stock Average finally attempting a rebound,
in the near term, it appears to be a volatile rebound phase, and if the rebound continues, the USD/JPY downward pressure
is expected to recede with various factors, and we anticipate a next sell-off zone.
The chart is“Ask Ultimate Shadow”Euro-dollar 15-minute intraday chart for the market from the ECB meeting to the US employment data. The price moves were accompanied by buy/sell signals and events!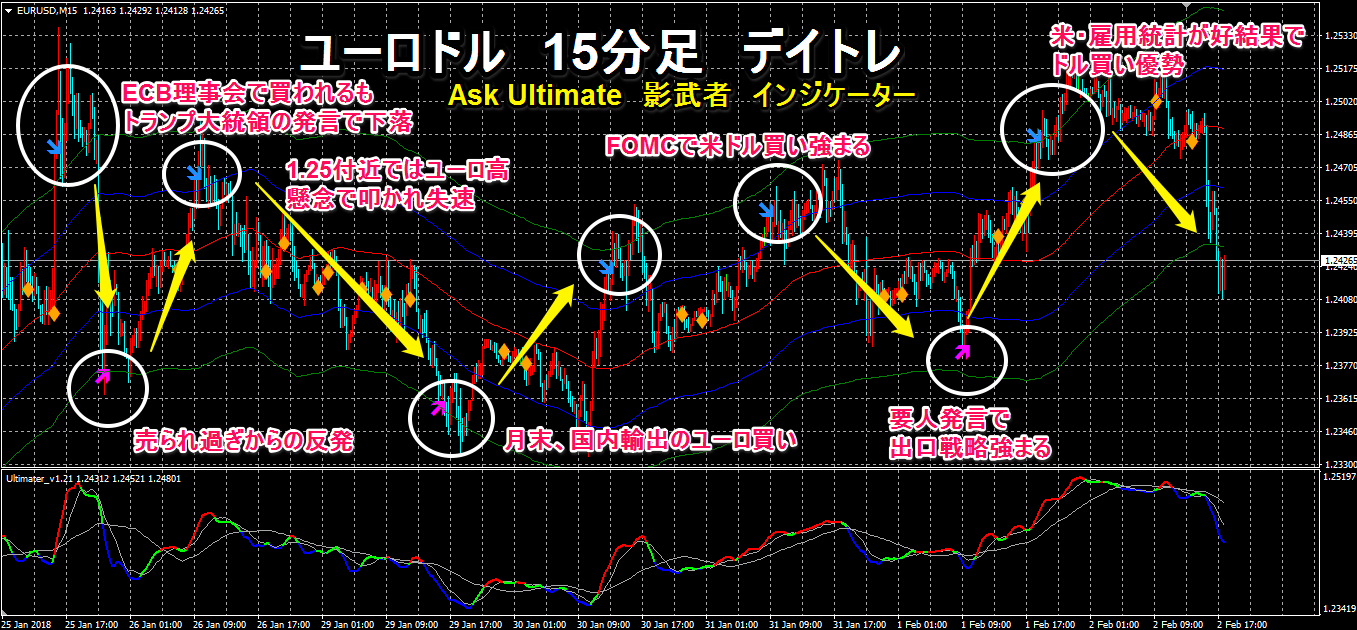
Click the image to enlarge!
Indicators are“Ask Ultimate Shadow”/“Forex Grip” development product
Ask Ultimate MAX/Shadow together on the 15-minute chart and others
to trade with reduced risk in fine detail!
For more details, click here↓↓↓

A Powerful Dollar-Yen Battle Zone Trade Giveaway Campaign!
● For each currency pair, entry and exit times are fixed!
● Participants quickly rotate in and out at each time, capturing the flow of the day’s market!
■ About the summer and winter time zones ■ One week ■ One month ■ One year market flow
● Trading technique “The Tokyo morning session is hot! This is the origin of the yen market battle!”
● Trading technique (long-term position)
● Ask Ultimate MAX / Shadow set products
Also a stronger tool for USD/JPY! Battle Zone Trade Indicator Gift!
“Forex Grip” trading technique – Ask Ultimate MAX (long-term) / Shadow (short-term) indicator included
What is Battle Zone Trade?