

Usage of "Visualizing Indicators" (Part 53)
Visualizing Indicator Utilization (Part 53)
1. Further evolving the “28 Currency Pairs List Indicator” into an indicator
Plot EURCHF with the “8-CP Visualization Indicator”
There are Oceania, London, New York, and AnyCP versions of the “8CP Visualization Indicator.” This time, the London version was used.
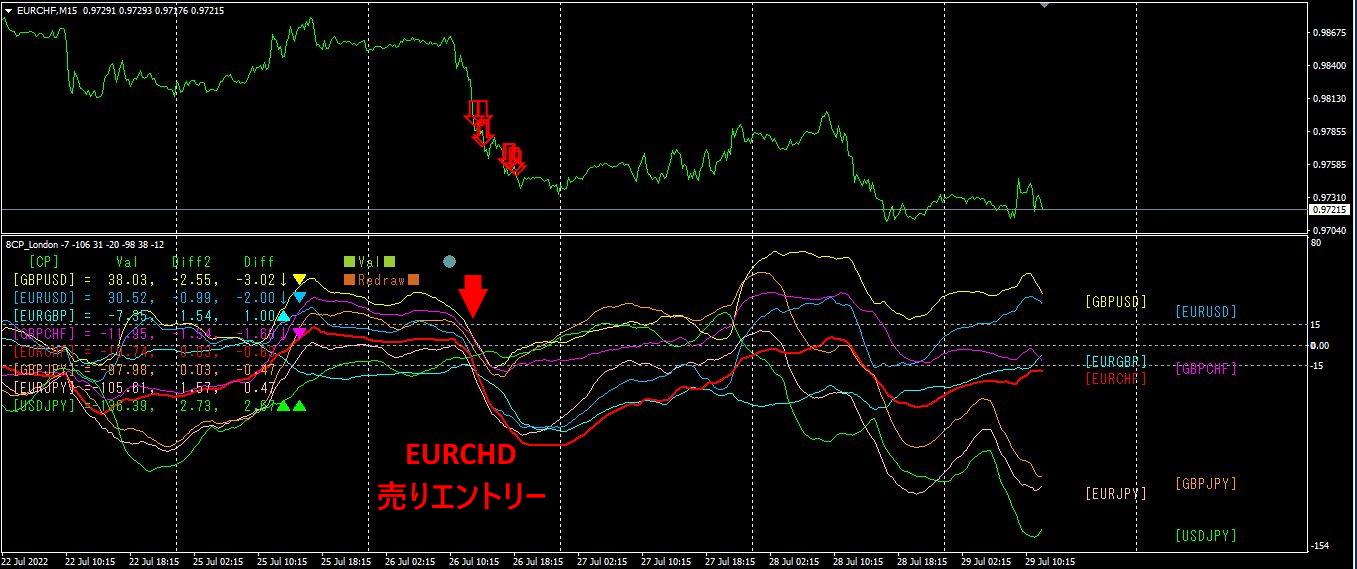
The top half shows the EURCHF 15-minute chart. The red arrows in the top half indicate the alert positions of the “28 Currency Pairs List Indicator.” The bottom half is the “8CP Visualization Indicator.” The red thick line on the graph corresponds to EURCHF.
On July 26 (Tuesday), in the European session, the graphs collectively began to move downward. The movements of EUR-related currency pairs were particularly noticeable. There were no notable economic releases, so the reason is unknown. Since the chart was trending downward, if you simply took the downward move, you could have earned about 50 pips of profit.
2. Trying the Best Select Indicator
The figure below is a screen capture taken automatically at 03:54 on July 28, 2022.
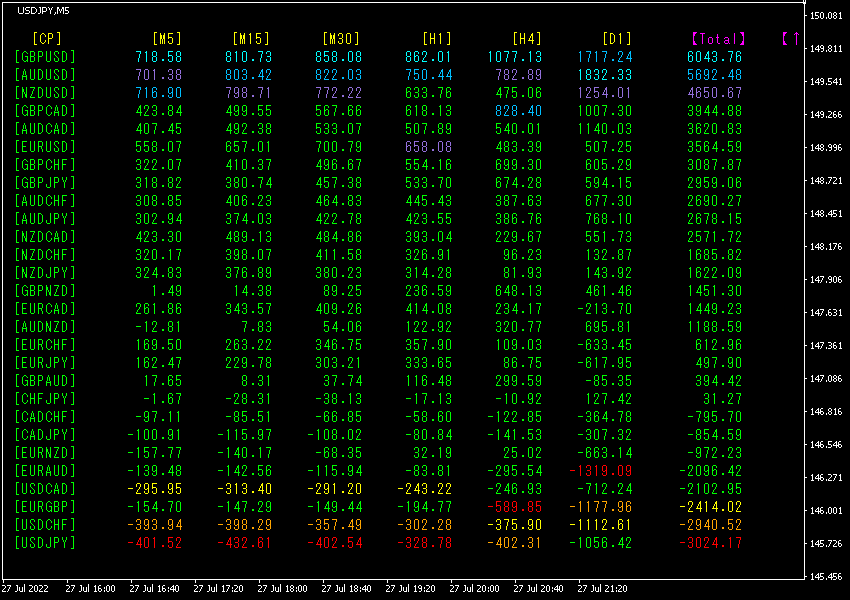
Data is sorted in descending order by Total.
At the top row, GBPUSD shows an uptrend, while at the bottom row USDJPY shows a downtrend. Now, let's look at the GBPUSD chart. The figure below is the GBPUSD 15-minute chart.
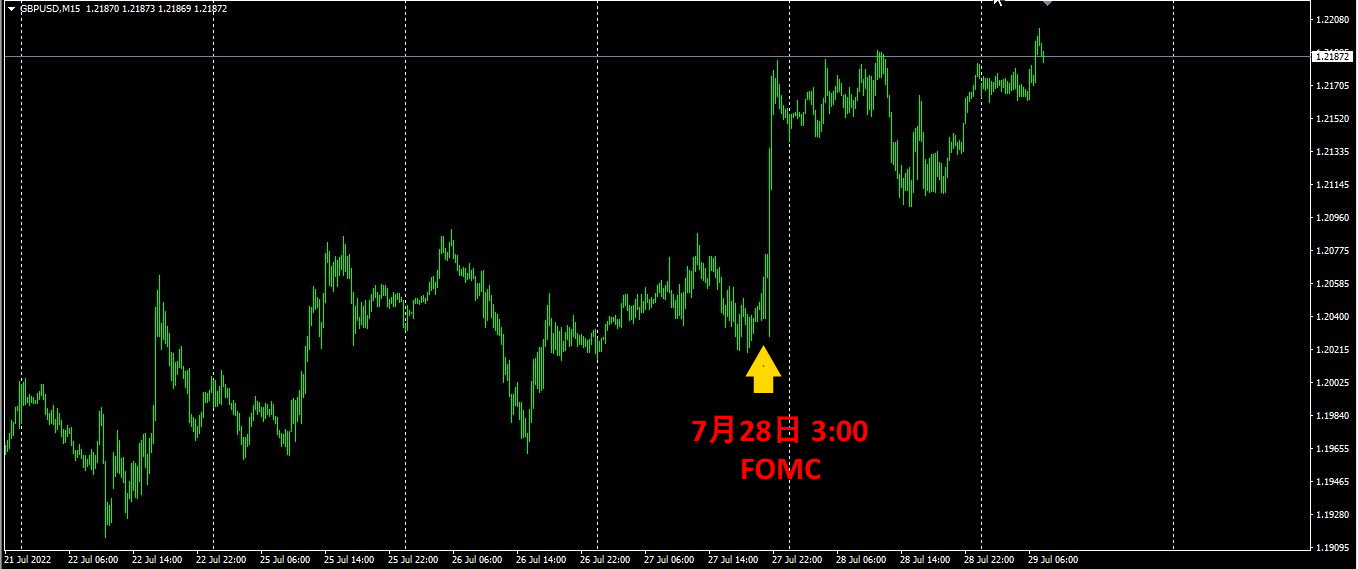
The sharp rise at 3:00 on the 28th was due to the FOMC. GBPUSD, already in a major wave of a reversal upward, would have yielded about 120 pips of profit if a long position had been held.
3. What happened to EURJPY, which has been followed since last May?
We have been tracking EURJPY since May 2021.
To see the overall trend, we draw roughly the last three weeks on a 30-minute chart.
Last time, I wrote the following.
When comparing EUR and JPY, the decline of EUR is stronger, so in terms of currency strength, EURJPY is expected to move downward. Based on this, EURJPY is likely to trend downward somewhat.
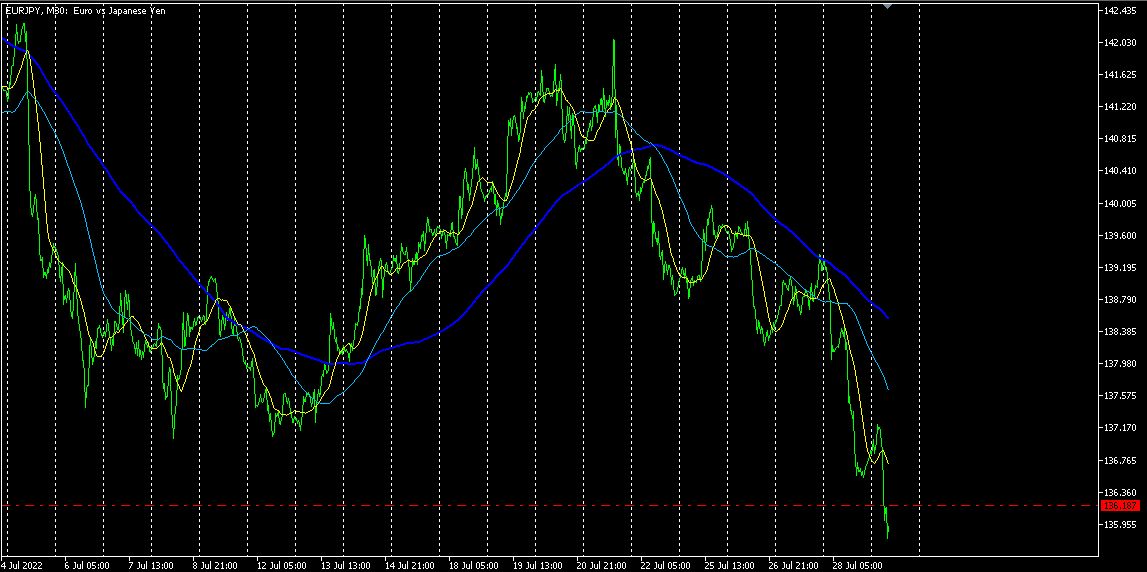
Indeed, it declined as expected.
We will also check currency strength.
The daily chart of the “8C Currency Strength Visualization Indicator.”
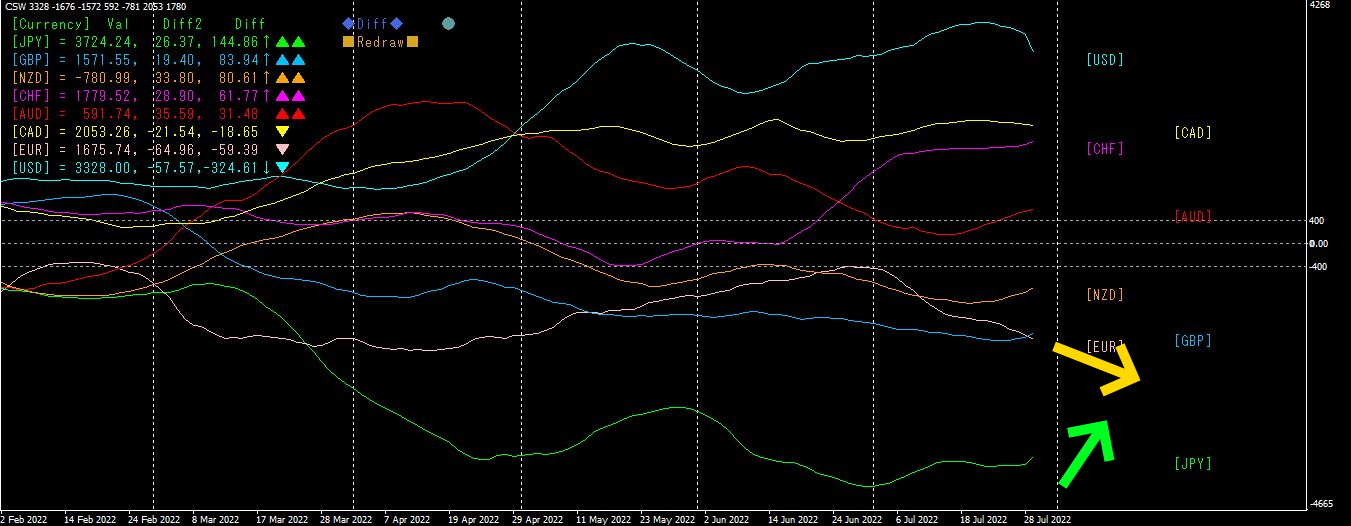
As always, USD remains the strongest currency, and JPY remains the weakest. Directionally, EUR is headed downward, and JPY is headed upward. As a result, currency strength indicates that EURJPY is likely to move downward.
From this, EURJPY is expected to further decline.
If you are interested in the “8C Currency Strength Visualization Indicator,” please refer to the following page.
【My Listed Items】
× ![]()


