

Elephoro Stock Exploration Extension: Feature Description and Performance Chart Display Function
Function Description
On the individual stock page of Stochastic Research (Sakatan), a "Chart" button is now displayed under the earnings tab's performance table,
and when you hover over this button, a chart visualizing the performance table values is shown.
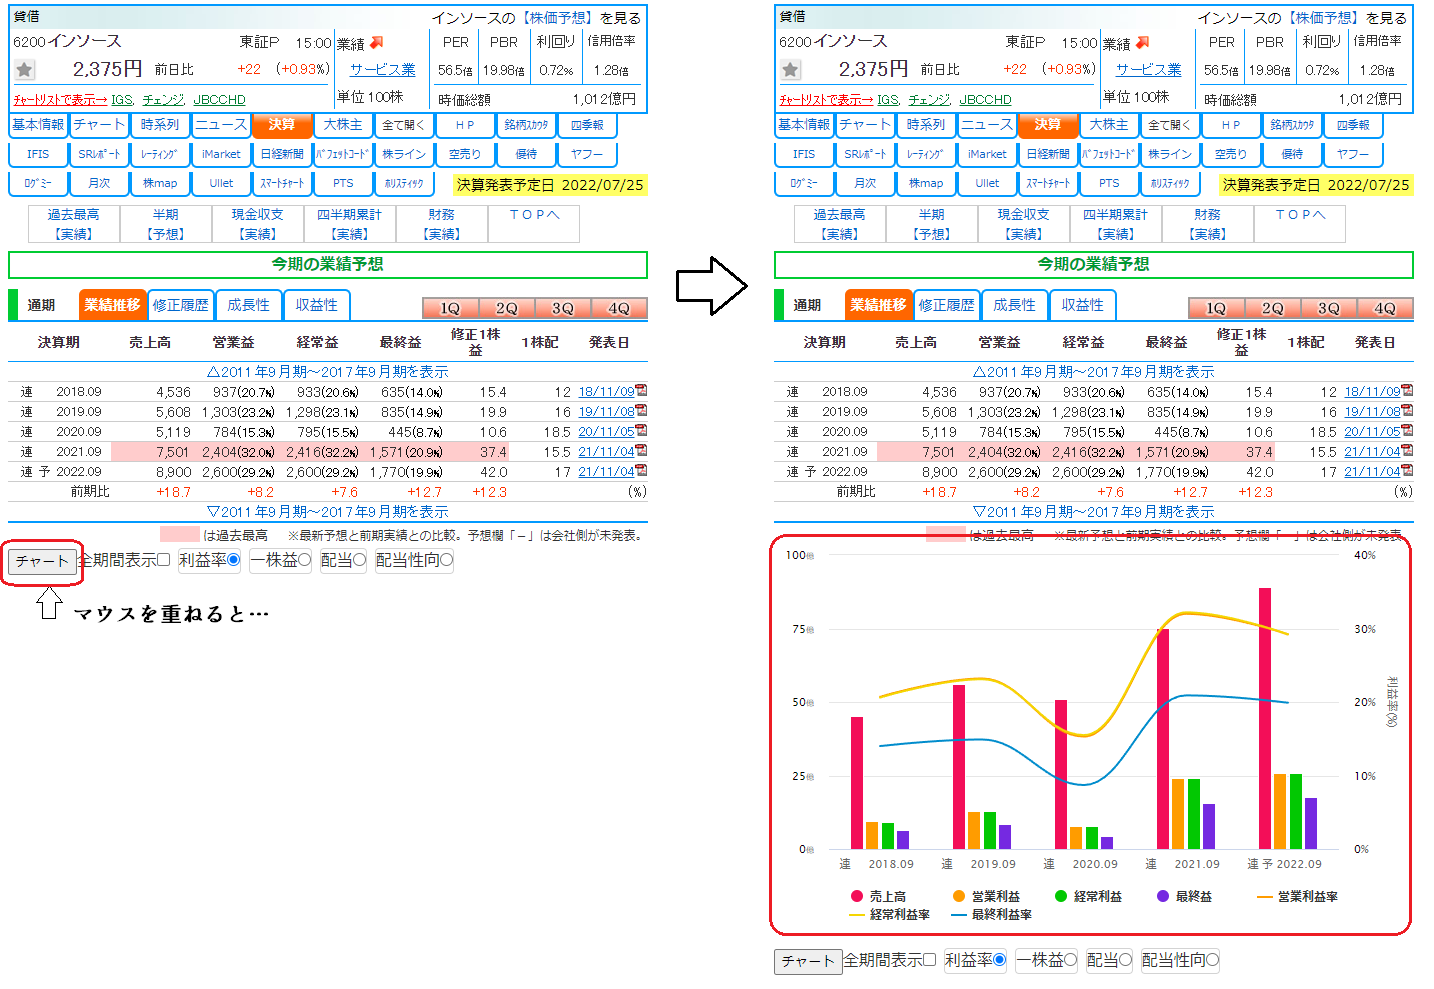
The chart has two axes,
the left axis represents "Sales," "Operating Profit," "Recurring Profit," and "Net Income" as a bar graph,
the right axis initially represents "Profit Margin (net income / sales)" as a line graph.
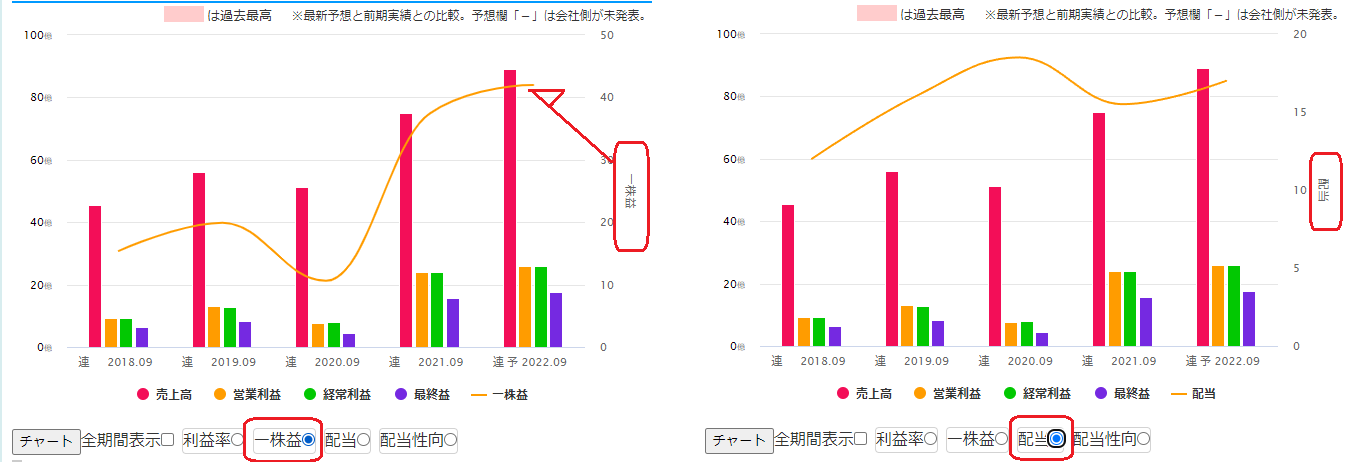
Items used on the right axis can also display "Earnings per Share," "Dividends per Share," and "Dividend Payout Ratio (dividends / earnings per share)."
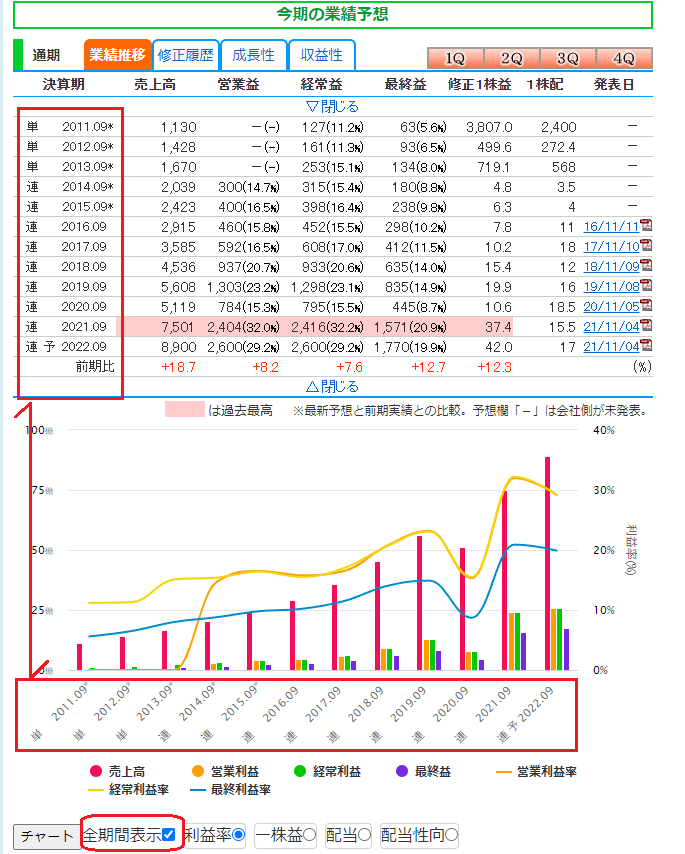
Also, if you are subscribed to Sakatan Premium, you can check "Show for all periods" to view a long-term chart.
Settings Options
Settings related to the performance chart can be found in the Options screen under Chart → Performance Chart.
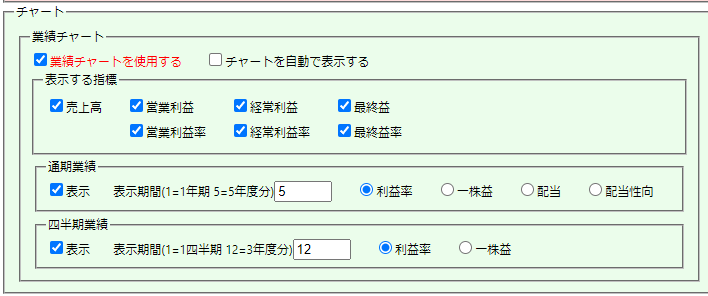
- 【Use Performance Chart】…When this checkbox is ON, the performance chart's "Chart" button and other elements are displayed.
If you do not need the performance chart feature, please uncheck this. - 【Automatically display Chart】…When this checkbox is ON, opening the individual stock's earnings tab will automatically display the performance chart.
When OFF, the chart is displayed when the mouse cursor hovers over the "Chart" button. The default is OFF. - 【Indicators to display】…Settings for items displayed in the performance chart.
- 【Full-term Earnings】…Display settings for the full-term earnings side of the chart.
- 【Display period】…The display period for the performance chart. The chart will display for the number of years set here. The default is 5 = 5 years.
- 【Profit Margin, Earnings per Share, Dividends, Dividend Payout Ratio】…Settings for items displayed on the right axis of the performance chart. The default is Profit Margin.
- 【Quarterly Earnings】…Display settings for the quarterly earnings side of the chart.
- 【Display period】…The display period for the performance chart. If set to 1, only one quarter is displayed.
The default is 12, which corresponds to 3 years. - 【Profit Margin, Earnings per Share】…Settings for items displayed on the right axis of the quarterly earnings chart.
The default is Profit Margin.
Since the Quarterly Earnings chart does not include dividend information, there is no dividend or dividend payout ratio.
- 【Display period】…The display period for the performance chart. If set to 1, only one quarter is displayed.