

Utilization of the "Visualization Indicator" (Part 50)
Utilization of the “Visualization Indicator” (Part50)
1. Further developing the “28 Currency Pairs List Indicator” into an enhanced indicator
“8CPVisualization Indicator”to drawEURUSD.
The “8CPVisualization Indicator” includesOceania version,London version,NewYork version,AnyCP version. This time, we used theLondon version.
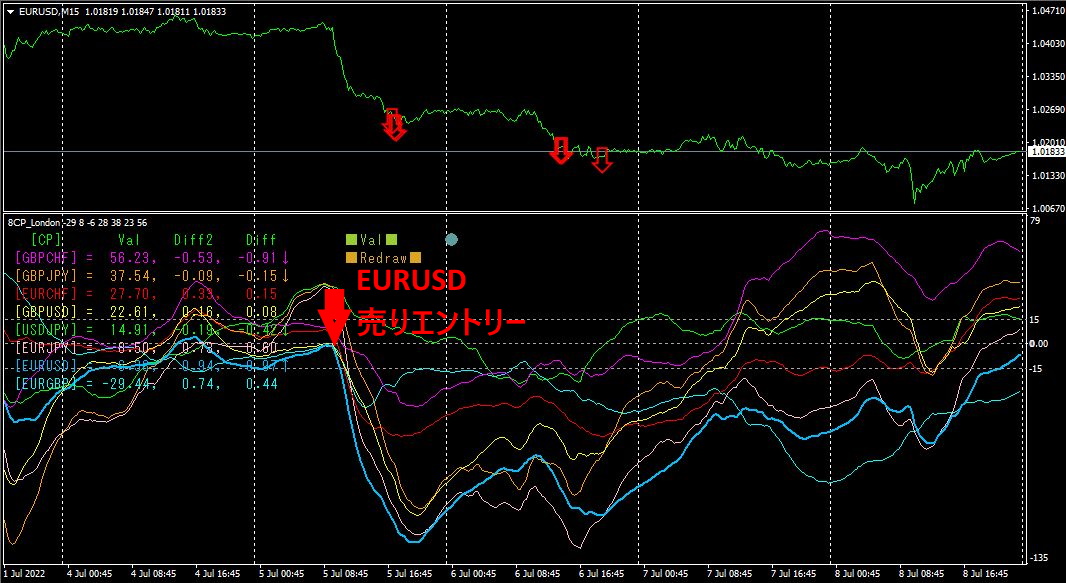
The upper half is theEURUSD 15-minute chart. The red arrows on the upper half indicate the alert positions of the “28 Currency Pairs List Indicator”. The lower half is the “8CP Visualization Indicator”. The blue-thick-line graph corresponds to theEURUSD chart.
On Tuesday, EURUSD fell below the other chart groups, so we entered a sell position. If we closed at the bottom of the chart that night, we would have gained about150PIPS of profit, and if held until the weekend, about300PIPS of profit could be earned.
2. Best SelectUsing the indicator
The figure below is a screen capture taken on July 9, 2022.
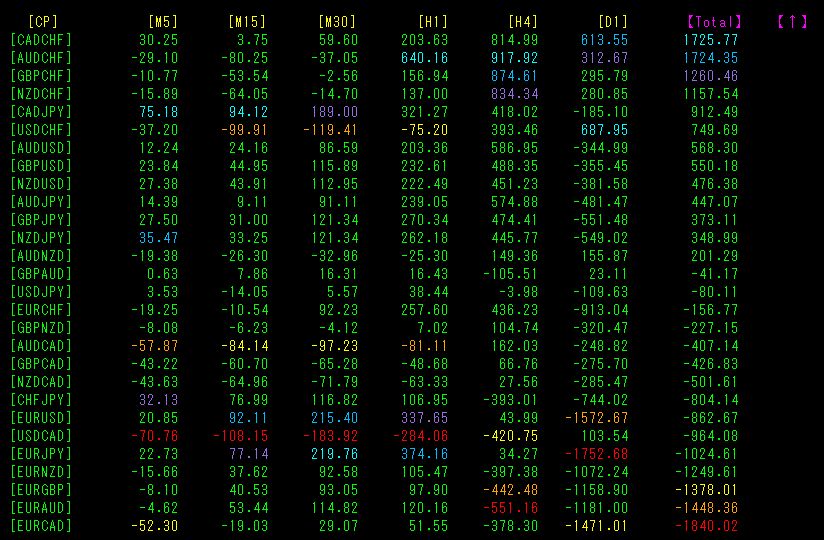
Totalnumbers are sorted in descending order.
USDCAD,[M5],[M15],[M30],[H1] are shown in red, but theTotal value is too low. This week there were no notable alerts.
3. Since last year, what happened with EURJPY that we've been tracking since May 2020?
Since May 2021, we have been tracking the movement of EURJPY.
To view the overall trend, we are drawing about the last three weeks on a 30-minute chart.
Previously, I wrote the following.
Since the yen is trending weaker, I thought it might rise, but it is being capped at higher levels. Depending on the perspective, it forms a large inverse head-and-shoulders chart pattern. From a chart perspective, it is bearish. The EUR in the daily chart with the “8CPCurrency Strength Visualization Indicator” shows EUR slightly downward,JPY shows slight upward movement, so EURJPY is predicted to move downward in the big picture.
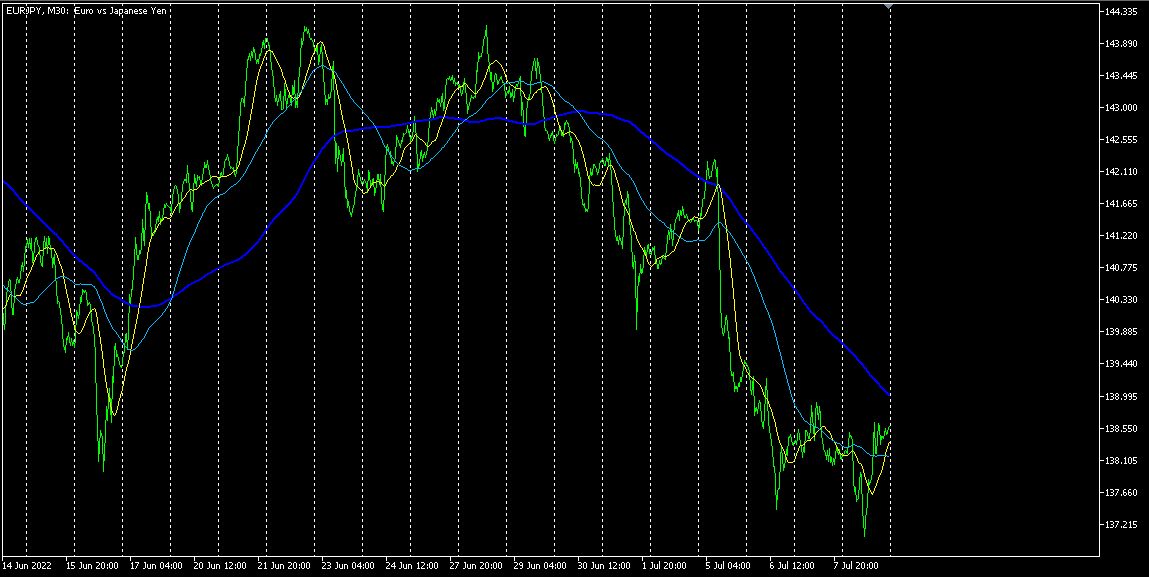
It moved sharply lower.
The figure below is the daily chart with the introduced “8CP Currency Strength Visualization Indicator”.
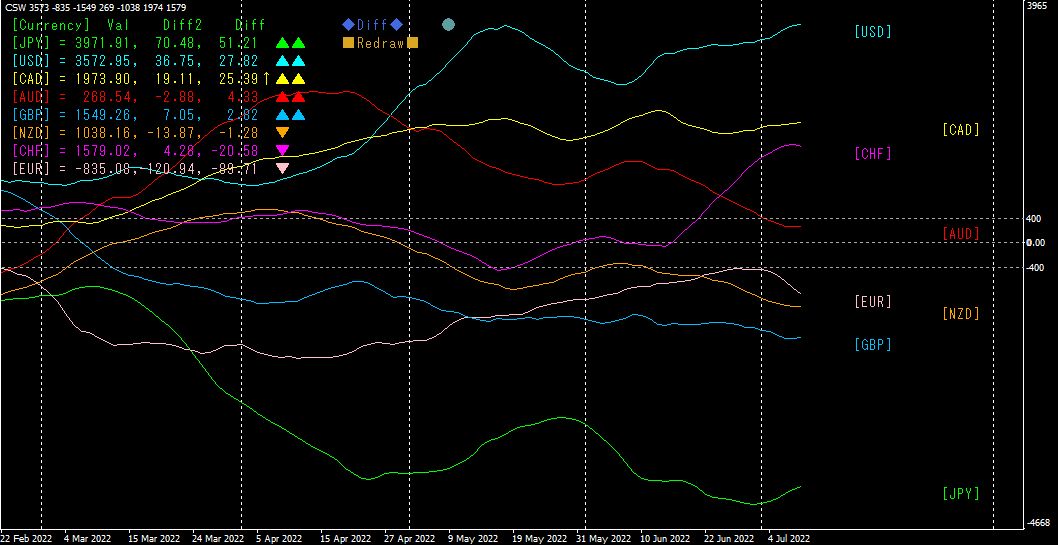
Compared with last week, the EUR graph has moved downward, and the JPY graph has moved upward. Looking at the rate of change, the maximum positive is forJPY, and the maximum negative is forEUR. In particular, EUR’s graph is dropping at a steep angle. Looking at the daily flow of currency strength, EURJPY appears to be headed downward.
“8C Currency Strength Visualization Indicator” for those interested, please refer to the following page.
MT4 version https://www.gogojungle.co.jp/tools/indicators/39150
MT5 version https://www.gogojungle.co.jp/tools/indicators/39159
【My listed products】


