

Risk/Reward – How to set the take-profit point (T/P) edition
Continuing from last time, this is about risk-reward.
Today“How to set the take-profit points (T/P)”is what I will introduce.
I plan to present four items.
① Previous highs and lows
② N-wave (1:1)
③ Bollinger Bands key levels
④ N-wave 38.2% & 61.8%
I’ll explain these four.
①② are recommended for beginners and fairly easy to judge.
③ is kept simple this time.
This is content I explained in the salon, but I’m planning to write a detailed summary about Bollinger Bands there?
④ This is the payment method I am currently using extensively.
At first it’s difficult, but once you can see the N-wave, it becomes a usable method.
Now I will explain in order.
① Previous highs and lows
Many of you have thought, “Entry when the previous high/low is broken!”
How did that trade go, at that time?
Did it seem to break but then come back?
Many of you may have felt that way, right?
Prominent highs and lows are points where orders accumulate.
If you Entry at such points, a retracement can of course occur.
Then shift from the side of taking losses to the side of taking profits.
In other words, make that your take-profit point!
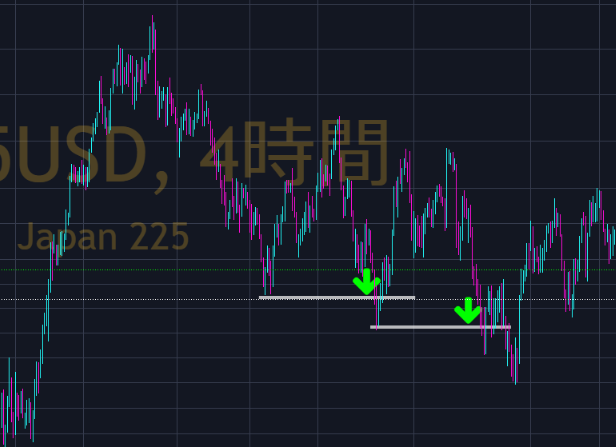
If you had Entry on this low break…
You wouldn’t have secured profits, would you?
Even if you did, it would be only 1–2 candles long?
The risk-reward would be very poor.
So let’s make it a take-profit point.
To do that, your Entry method changes, but the take-profit vs. Exit at the previous high/low means this:
Rather than saying you won or lost at where others’ orders pile up, turn there to the side that takes profits.
② N-wave (1:1)
This is a method of taking profits using the N-wave, which was discussed under the item “N-wave” in the basic chart.
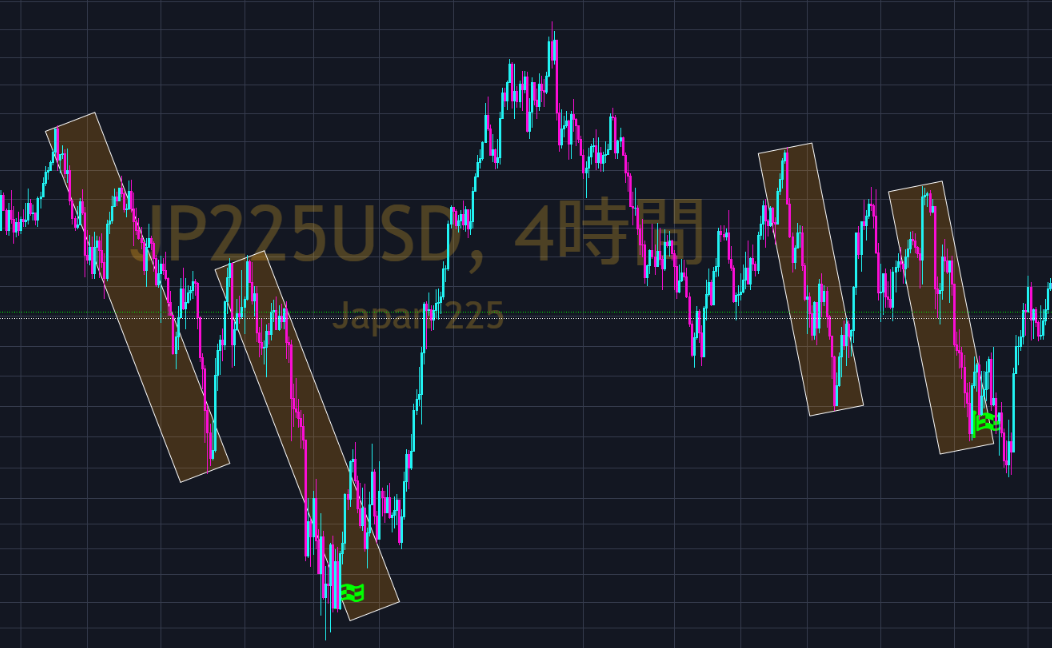
Both are take-profit points based on N-wave.
That said, this is post hoc, so it rarely fits perfectly lol
I’ve brought the perfect fit here though lol
Most products write like this, “See, it’s easy, right?”, but I don’t say that ????♂️
Now, let me take the right-side N-wave as an example and explain the actual thinking.
Look at the drop reversal from roughly the middle of the top chart.
First, the green N-wave appeared.
It dropped further, so I measured that too, but the width did not match and it reversed upward (not matching, so I marked it in red).
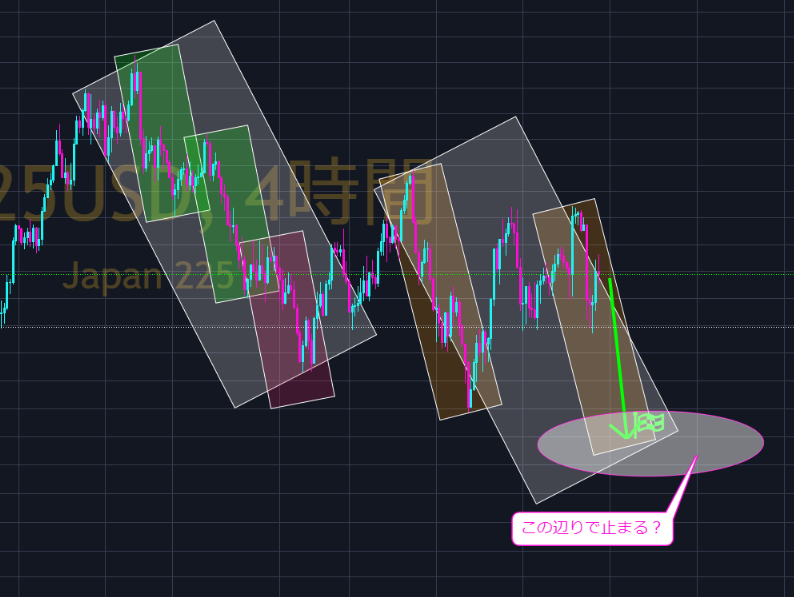
I’ve enclosed the whole drop width up to that point in white.
Then after the pullback, it turned down again, so the orange width could be drawn.
After the pullback, copy the orange width.
Also copy the white width.
There is a considerable overlap in widths.
Therefore you can infer that it might stop and reverse here.
And that result is the ?
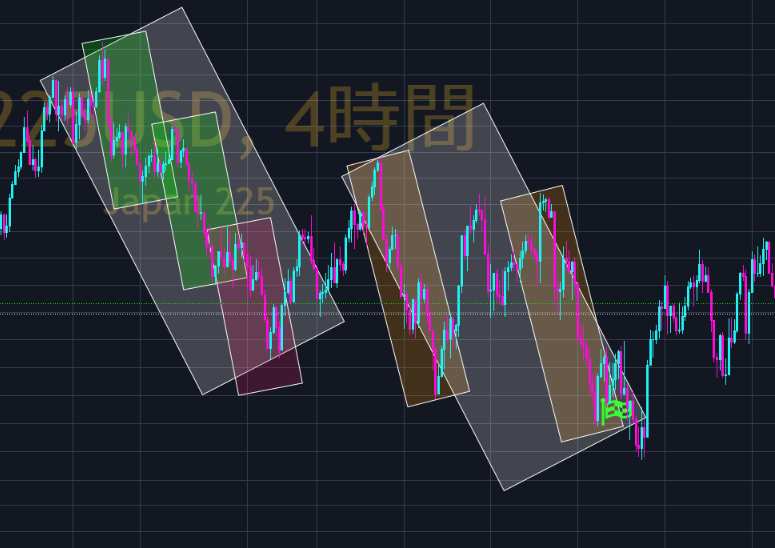
Even a single N-wave can be a take-profit point,
and if two N-waves overlap as in this case, the probability increases further.
I also look for take-profit using N-waves, you know?
※ I’ve enclosed with a square here,Fibonacci Expansioncan be drawn accurately, you know lol
Partial take-profit at 1:1, full take-profit at 1:1.382 or 1:1.618 is also possible, right?
③ Bollinger Bands key levels
There are several exit methods, but I’ll introduce one of them.
“Intersection with a sideways Bollinger Band”
as an exit.
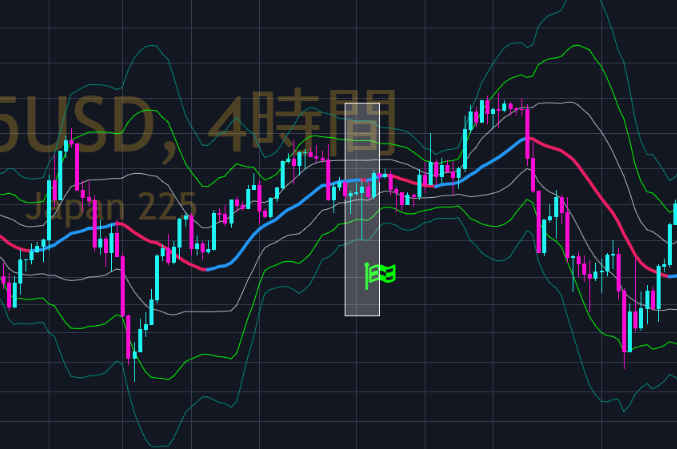
When using Bollinger Bands, you look at multiple timeframes, so you can’t simply say “See?!”
It’s not that simple.
However, the sideways Bollinger Band acts as“resistance”for price movement.
Therefore, I intend to use it as a basis for exits.
This area would require a lot of explanation, so I’ll discuss Bollinger Bands in a dedicated section?
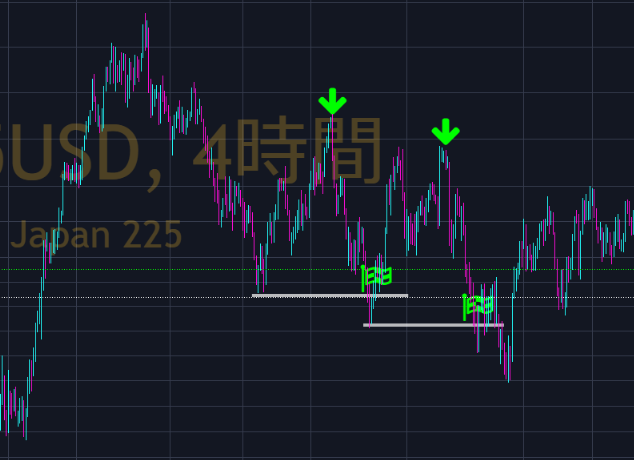
④ N-wave 38.2% & 61.8%
“See the I-wave and claim that everything reverses at 61.8%!”
I disagree with that, but it’s quite usable with N-waves.
The T/P-Zone (green) settings I useHowever, this is not everything, so I’ll discuss details another time.
For this time, I’ll keep it simple as well.
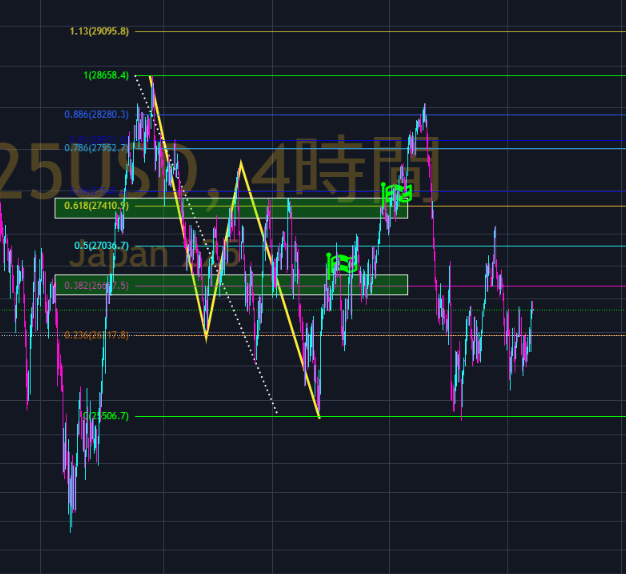
For the yellow N-wave, there are two T/P-Zones (green),
these correspond to the 38.2% and 61.8% of the Fibonacci Extension applied to the entire N-wave.
(※Here I’m drawing the green Zone for markers, but normally I use a different technique to render the Zone, so the drawing method differs。)
This time the First-Target-Zone (38.2%) was reached and reversed downward,
then it rose again and greatly exceeded the Second-Target-Zone (61.8%).
Your risk-reward depends on where you entered, so you may take full profit at 38.2% or take partial at 38.2% and let the remainder run to 61.8%.
Was that the reason for two take-profit points I post on Twitter?
Today
①② Simple take-profit methods
③ Take-profit method using Bollinger Bands (part) also shared in the salon
④ My take-profit method (briefly)
I’ve introduced three take-profit methods.
As always, this isn’t everything, and nothing says it must be this way.
If you disagree with this take-profit method, you don’t have to use it.
I believe those who truly want to study will read this, so I’m writing in hopes it might be of some help to them?
From the methods introduced today, you may adapt them yourself, or they might inspire a new method.
If so, thoroughly verify and calculate data, and determine whether you can use it effectively.
If you’re still a beginner and can’t do that yet?
I plan to publish in the salon the Bollinger Band method I showed there as a possible option?
Please bear with me a little longer.
That brings us to the end for now.
Thank you for reading to the end. m(_ _"m)

※ I’m truly grateful for your kind words as always.
Thank you very much.
The following is paid content, but there are no articles in the paid portion, so please note?
A few people have asked to show their appreciation, so I created this.
To those who purchased, thank you so much?