

Utilization of “Visualization Indicators” (Part 46)
Utilization of the "Visualization Indicator" (Part46)
1. Further evolving the "28 Currency Pair List Indicator" into an indicator
“8 CP Visualization Indicator” for drawing AUDJPY withAUDJPY
The “8 CP Visualization Indicator” includesOceania edition,London edition,NewYork edition,AnyCP edition. This time, I used theOceania edition.
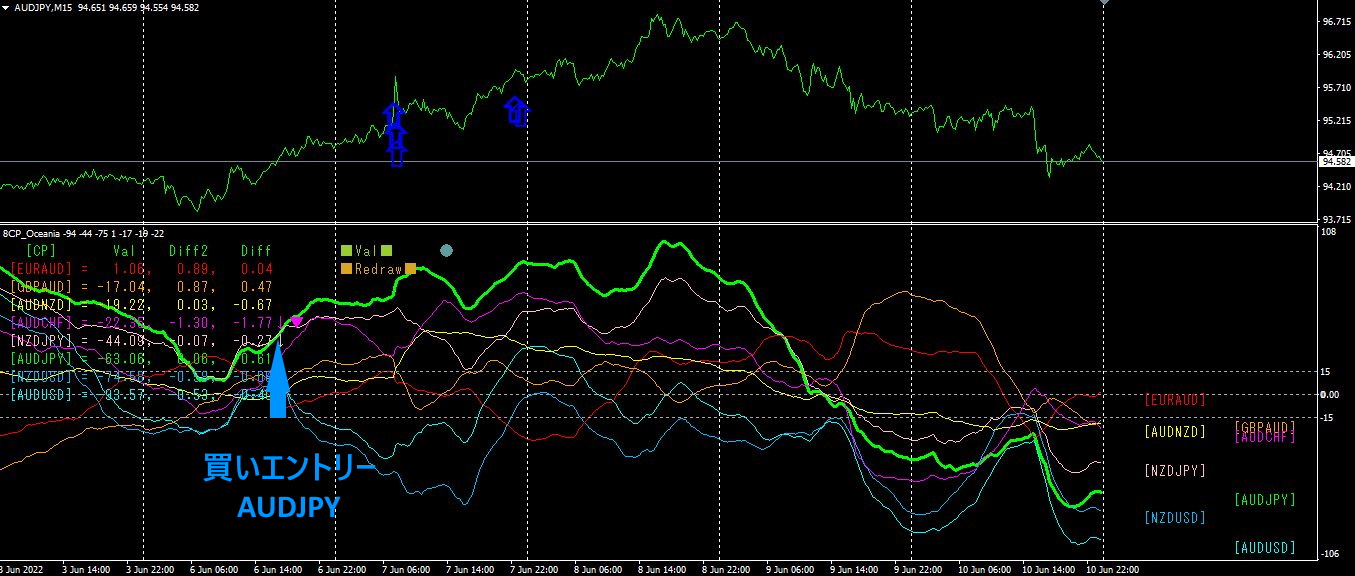
The upper half is theAUDJPY 15-minute chart. The blue arrows in the upper half indicate the alert positions of the “28 Currency Pair List Indicator”.AUDJPY.
If you buy AUDJPY on Monday and close on Wednesday, you could have gained aboutAUDJPY profit on the order of200PIPS.
Even aiming for the decline from Thursday to the weekend would have been profitable.
2. Trying Best Select indicator
The figure below is a screen capture taken at 13:30 on June 7, 2022.
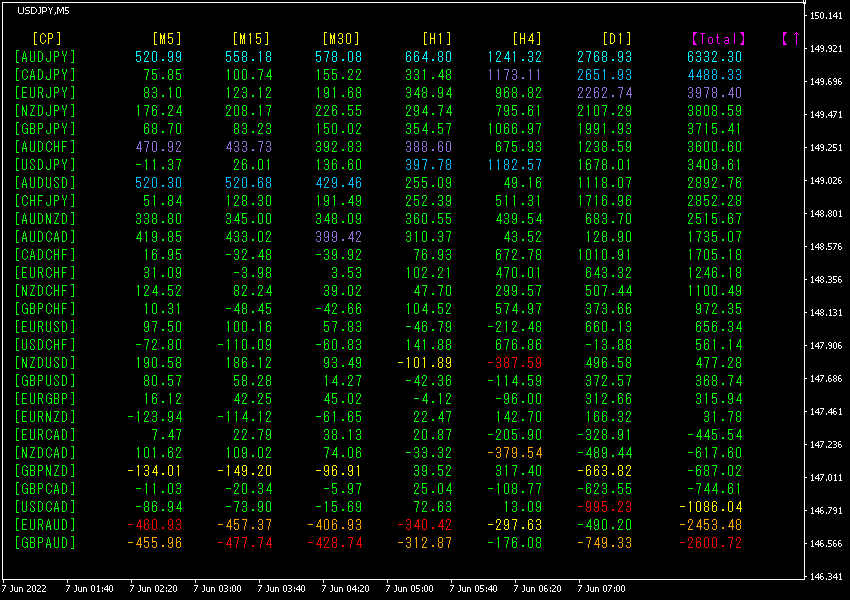
Total is sorted in descending order by value.
In the top row,AUDJPY shows all numbers in light blue. Moreover, the Total value is as high as6456.68, indicating a strong upward trend.28 currency pairs, among themAUDJPY is the strongest rising across all timeframes from[M5] to[D1], though the numbers are extraordinary.RBA rate decision appears to be the cause.
3. What happened to EURJPY, which has been tracked since last May?
year 5 month EURJPY movements are being tracked.
To view the overall trend,30-minute chart covers about3 weeks of recent data.
Last time, I wrote the following.
It continues to rise sharply. It is rising at a steeper angle than the lower boundary of the triangle pattern. It seems there is still upward momentum.
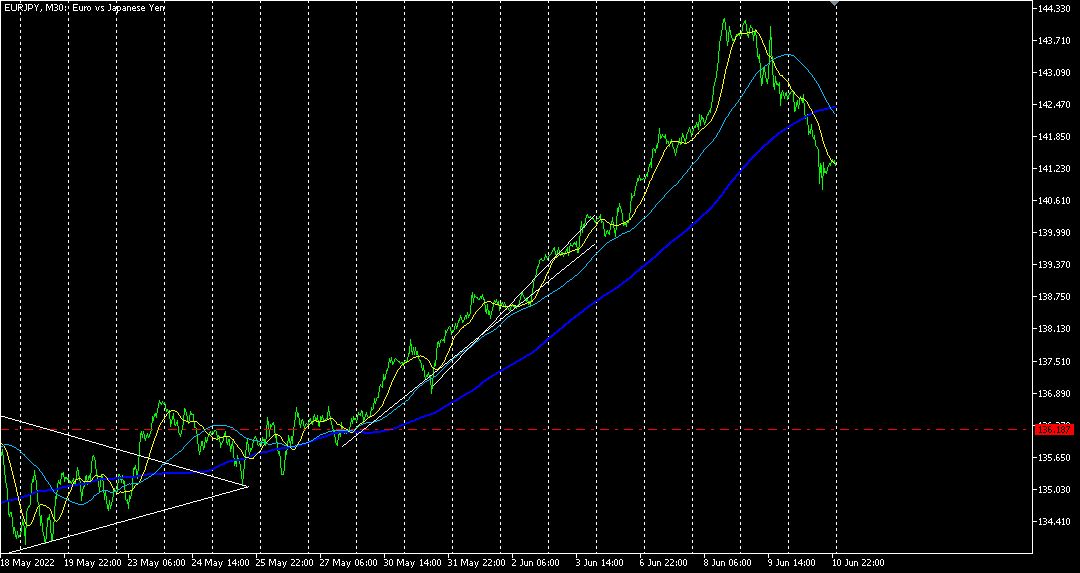
It has stretched almost straight up, but after exceeding the previous high by more than700PIPS, it has started to top out.
During this period, the yen as a currency was greatly weakening, contributing to the high EURJPY. I think future movements will be influenced by the degree of yen depreciation, but for now the yen depreciation trend has somewhat eased, limiting upside.
4. Long-term trading recommendation
Until now, this blog has mainly assumed day trading. Day trading isn’t bad, but recently I have started to think that long-term trading based on daily charts and 4-hour charts may be the true essence of investing.
Please see the paid article "The Path to Investing Greatness" in Investment Navi+ for more details.


