

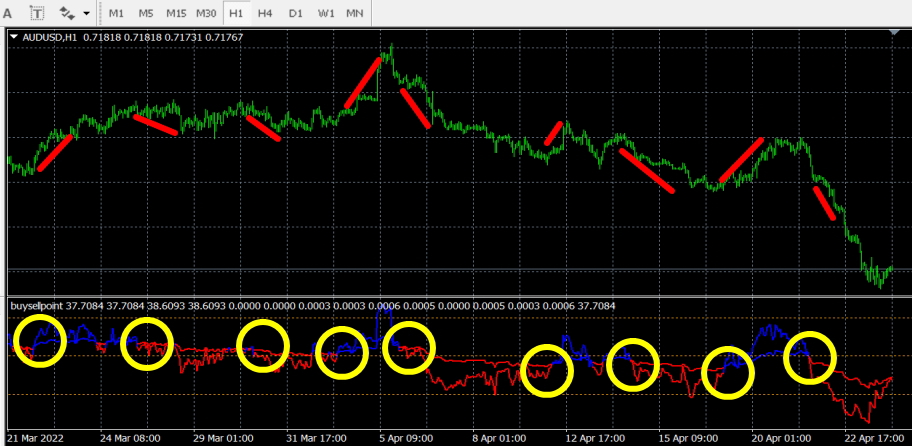
"Ultimate Buy/Sell Point Detection Indicator" The two lines in the sub-window indicate the buy/sell points! Since it is displayed in the sub-window, the optimal times to sell or buy are obvious at a glance.
The "Ultimate Buy/Sell Point Detection Indicator" shows buy and sell points with two lines in the sub-window!

Purchase from here!
https://www.gogojungle.co.jp/tools/indicators/38008
How to use the indicator
Indicator performance
EUR/JPY 4-hour chart
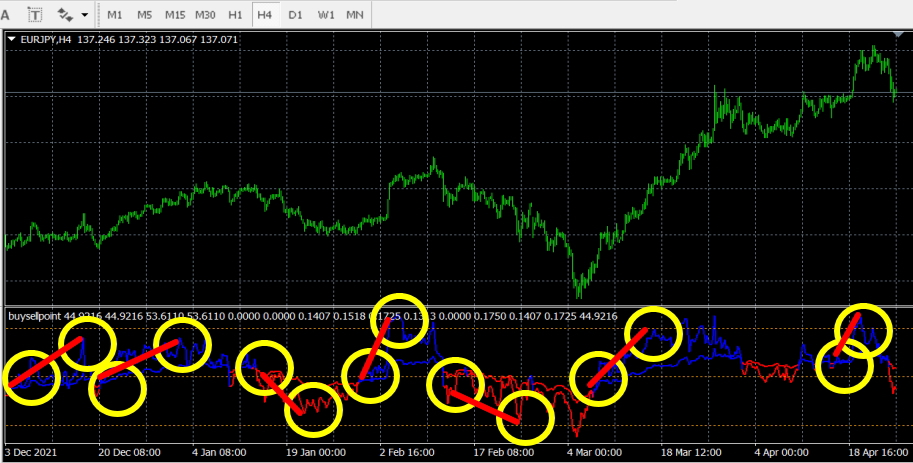
After both lines in the sub-window turn blue, the price rises significantly. Also, after both lines in the sub-window turn red, the price falls significantly.
EUR/CHF 4-hour chart
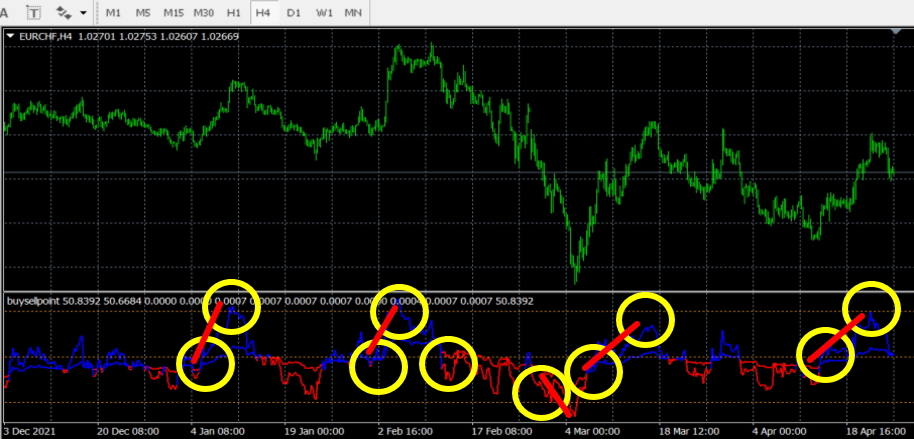
After both lines in the sub-window turn blue, the price rises significantly. Also, after both lines in the sub-window turn red, the price falls significantly.
GBP/JPY 4-hour chart
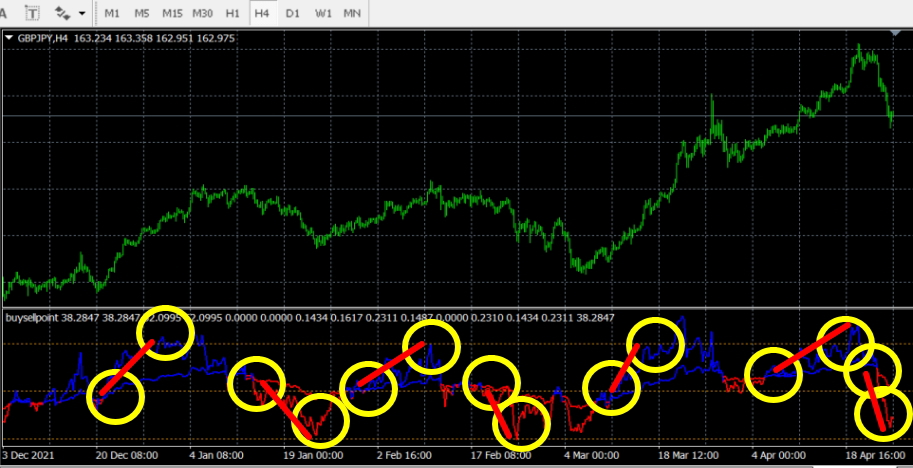
Similarly, after both lines in the sub-window turn blue, the price rises significantly. Also, after both lines in the sub-window turn red, the price falls significantly.
Features of the indicator
- Available for all timeframes and currencies.
- Available for MT4.
- Sell timing: When both lines in the sub-window turn red, sell. Hold until the dashed 30 level and then sell.
- Buy timing: When both lines in the sub-window turn blue, buy. Hold until the dashed 70 level and then sell.
Purchase from here!