Capture pullbacks and rebounds with Bollinger Bands! 'JBB2018'

Bollinger Bands are not used for contrarian trading!
JBB2018, which is said to have been developed after a lecture by John Bollinger.
Bollinger Bands were created as an indicator to visually measure this characteristic.
So, where should you enter after Bollinger Bands have extended?
What makes that possible is this JBB2018.
With a correct understanding of Bollinger, can we capture major market trends?!
【How to read the indicator】
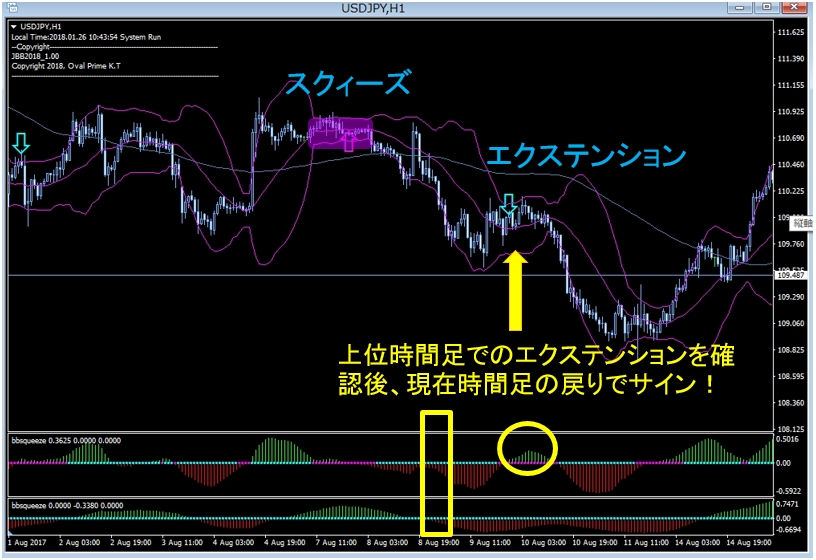
If you are using a 1-hour chart or longer, a single chart might be sufficient, but
the recommendation is to use longer timeframes
Weekly > Daily > 4-hour > 1-hour
they say.
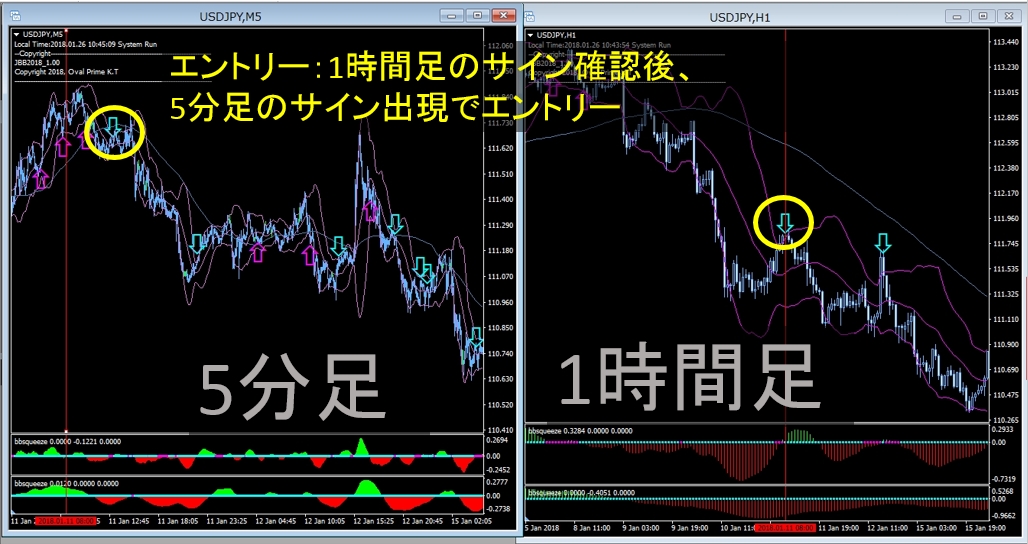
For day trading,
1-hour chart > 5-minute or 1-minute
to align the direction and enter.
Profit taking: BB20 (when price breaks the magenta BB)
Stop loss: when price breaks SMA100 in the opposite direction
that is.
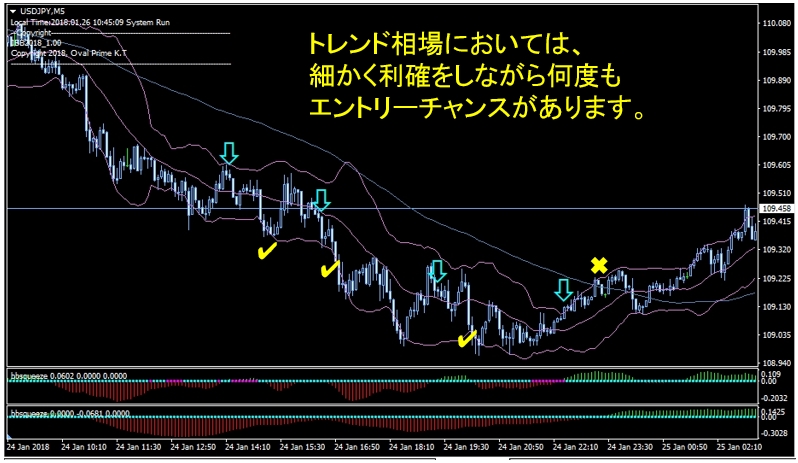
The take-profit width on the USDJPY 5-minute chart is about 10 pips.
On the 1-hour chart, signals are fewer, but you can expect about 20-50 pips.
You might think that exiting via Bollinger Band width is too early, or that there might be more profit to be made,
but
since there is a possibility of a rebound when hitting the Bollinger Bands, take partial profits and
wait for another entry opportunity for better efficiency!
If you want to know more about JBB2018,
they also offer streaming broadcasts, so keep an eye on the signals!
https://www.youtube.com/channel/UC6G6Tx6GMuCMyFTY455CvJQ/featured