

Today’s Elliott Wave 15M status
I will explain the indicator called ElliotWave15M.
This is the 15-minute wave at the start of today.
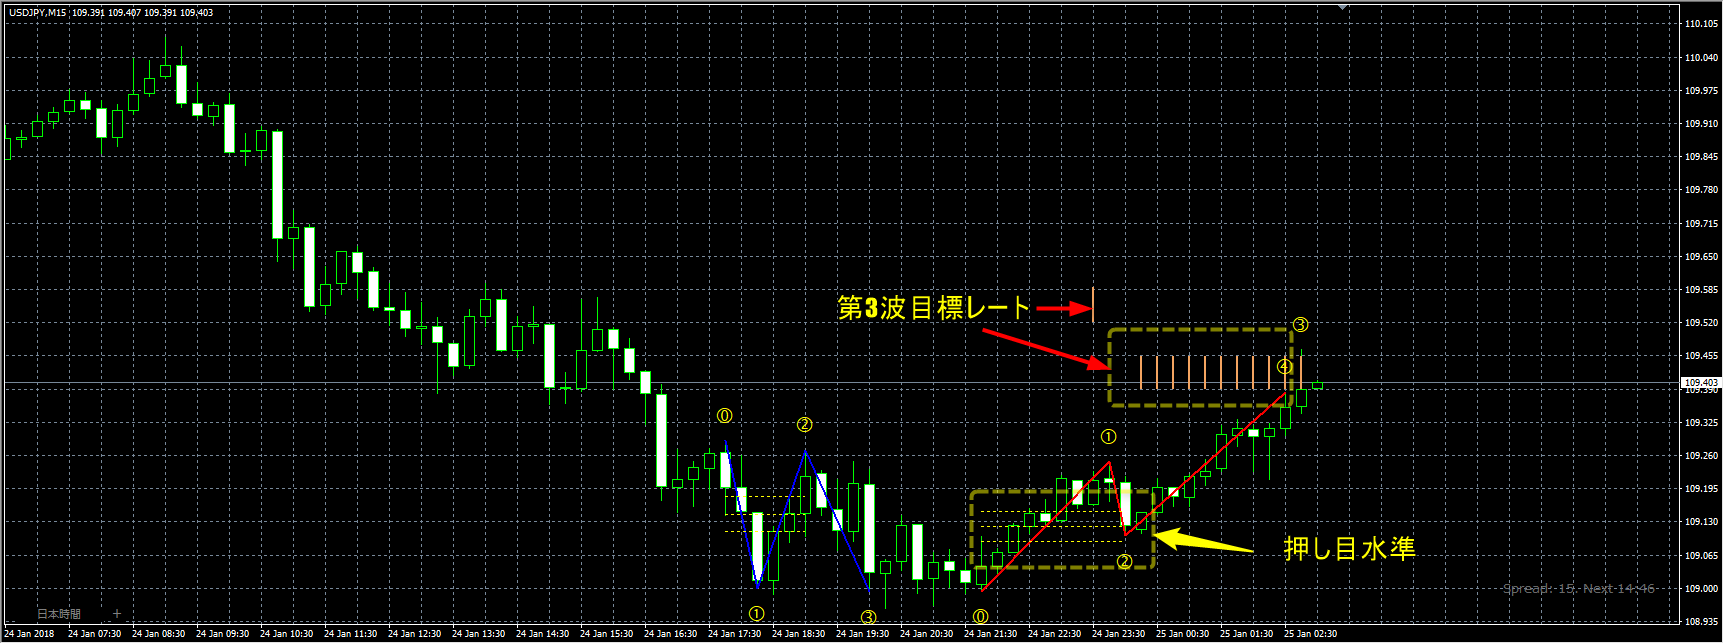
The yellow dashed line is the pullback level.
The skin-colored shaded area indicates the target rate.
The yellow numbers ①–⑤ indicate the waves of the Elliott Wave.
In this chart, ① is the initial move of the trend, ② is the initial pullback, and ③ is the third wave, which is considered the strongest wave of the Elliott Wave.
Unlike other indicators, there is no repainting at all, and it is not about arrows appearing; the target rate is displayed on the chart in advance.
Because of this, you don’t need to stay glued to the chart all the time, and since the exit point is clearly shown at the time of entry, you can estimate risk relative to the price range, and assess whether the trade is worthwhile.
In backtests, for USD/JPY and GBP/JPY, it has been shown that the target rate display is extremely accurate.
These are the backtest results for the EA distributed for free on this site under conditional terms.
USD/JPY (backtested with a 18-pip spread)
GBP/JPY (backtested with a 38-pip spread)
Backtests are conducted rigorously without disguising the spread.
If you would like to learn more about this indicator,click here


