

Introduction to ElliotWave15M
Introducing the ElliotWave15M indicator for MT4.
When it comes to MT4 indicators, most of them focus on entry points.
By the nature of indicators, most users are discretionary traders, but in actual discretionary trading, is the point of indecision the entry point?
Perhaps the real challenge is not where to enter, but where to exit?
For those who have such concerns, we introduce a powerful tool—a reliable indicator.
That is ElliotWave15M.
The underlying logic is based on the theory of “Elliott Wave Theory,” which formalizes the cycle of market waves.
To put Elliott Wave Theory simply, it can be described as follows.
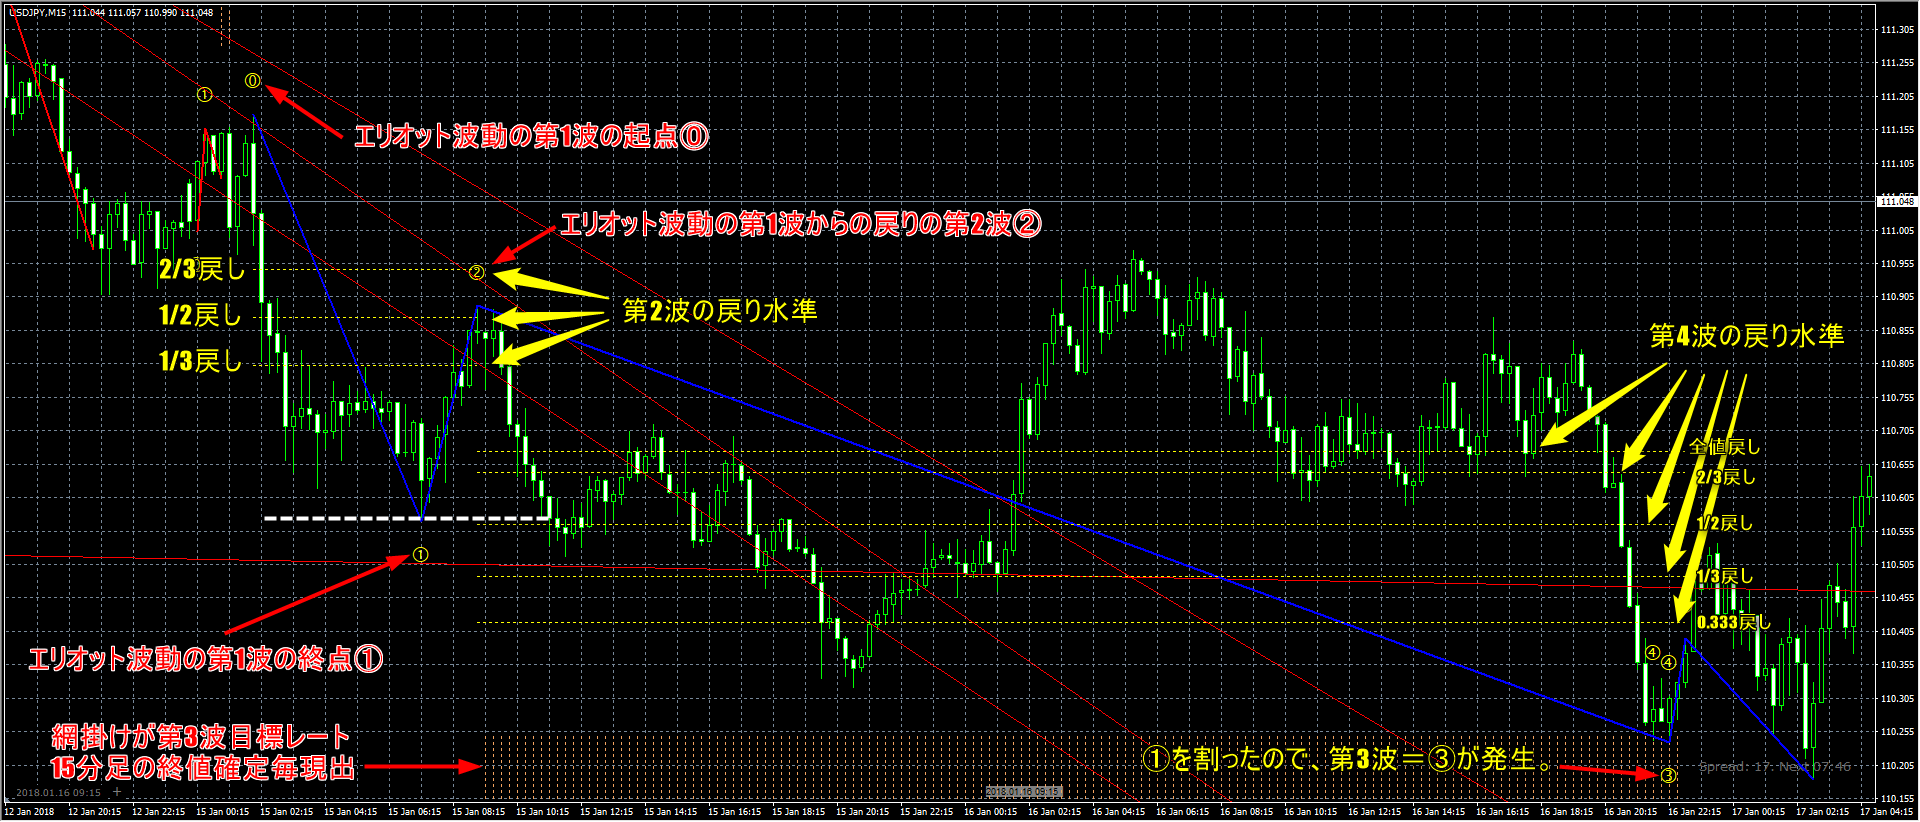
Wave 1 … the initial move that marks a trend reversal. Among the impulse waves, it is most likely to be the shortest.
Wave 2 … the retracement of Wave 1, a pullback/ correction wave.
Wave 3 … the impulse wave. It is usually the longest and the strongest wave.
Wave 4 … the correction of Wave 3. In textbook terms, it never crosses the peak reached by Wave 1.
Wave 5 … the last impulse wave. It is often the final phase of a trending market.
After Wave 5 finishes, a corrective waves a–c appear.
ElliotWave15M clearly charts the retracement levels of Wave 2 and Wave 4, and the target rates for Wave 3 and Wave 5, with shading on the chart for easy understanding.
This logic is supervised by the administrator of “the site of the person posting on Yahoo! Finance Bulletin Board.”
If you would like to know more about ElliotWave15M,Click here


