

Utilization of "Visualization Indicators" (Part 41)
Utilization of the “Visualization Indicator” (Part41)
1. Further evolve the “28 Currency Pairs List Indicator” into an indicator
“8 CP Visualization Indicator”GBPCAD drawingwithGBPCAD
The “8 CP Visualization Indicator” hasOceania version, London version, NewYork version, AnyCP version. This time, we used theNewYork version.
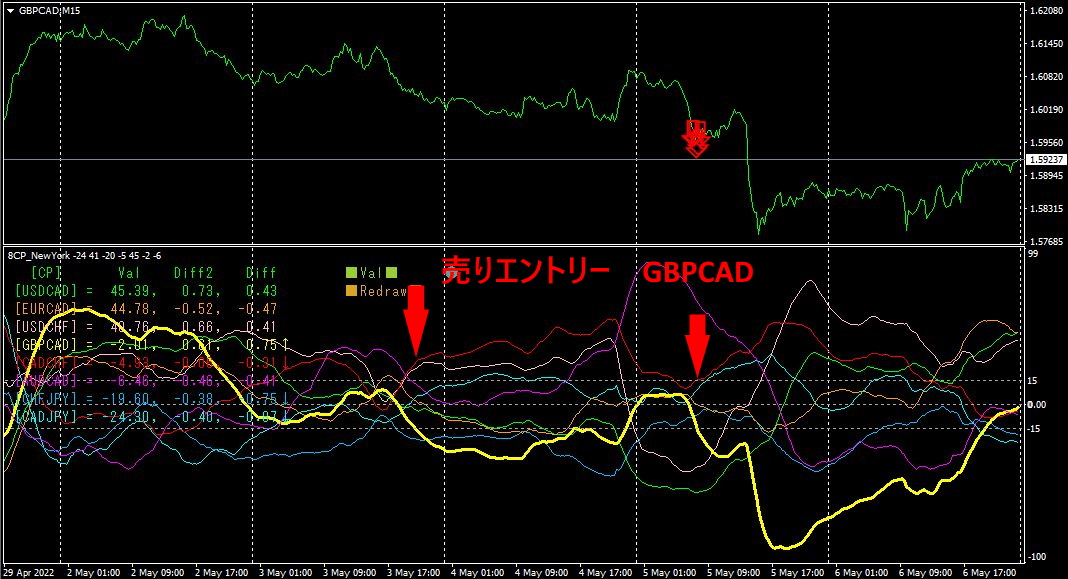
The upper half is aGBPCAD 15-minute chart. The red arrows indicate the alert positions of the “28 Currency Pairs List Indicator.” The lower half is the “8 CP Visualization Indicator.” The yellow thick-line graph corresponds toGBPCAD.
On Tuesday, the “8 CP Visualization Indicator” and on Thursday the “28 Currency Pairs List Indicator” along with the “8 CP Visualization Indicator” sell entry points appear. If you sold GBPCAD on Tuesday, you could have earned about240PIPS in profit; from Thursday onward, about170PIPS in profit was possible.
2. Best SelectUsing the indicator
5Month6 Day, display from the28CP Best Select
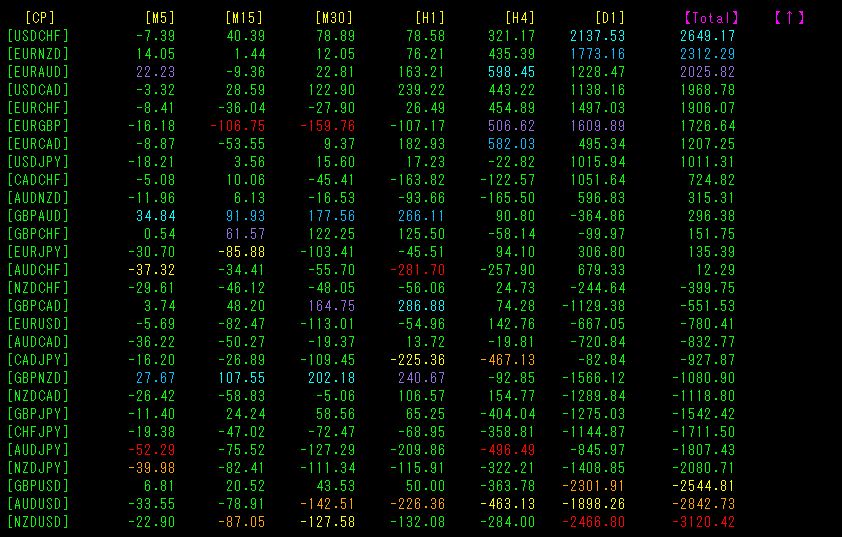
[Total] sorted in descending order. Unfortunately, none of the rows have aligned colors. Numerically, none exceed ±3500. In such cases, there is no trend, so the best practice is not to trade. Do not trade just for the sake of trading; “take a break when the market is quiet.”
By using the “28CP Best Select indicator, from among 28 currency pairs, you can identify which pair is in the strongest uptrend, which is in the strongest downtrend, and which pairs to trade. Conversely, it also tells you when the market lacks a trend, so you won’t fall prey to overtrading.
3. What happened to EURJPY since last year5 month?
Since 2021 year5 month, we have been tracking the movement of EURJPY.
To see the overall trend, a30 minute chart covering roughly the last3 weeks has been drawn.
Previously, it was written as follows.
It has declined. The dollar/yen briefly exceeded130 yen, butEURJPY failed to surpass the previous high. This suggests the uptrend that had continued is ending. Now, let us aim for a “break downward!” with targets like a double-top neckline.
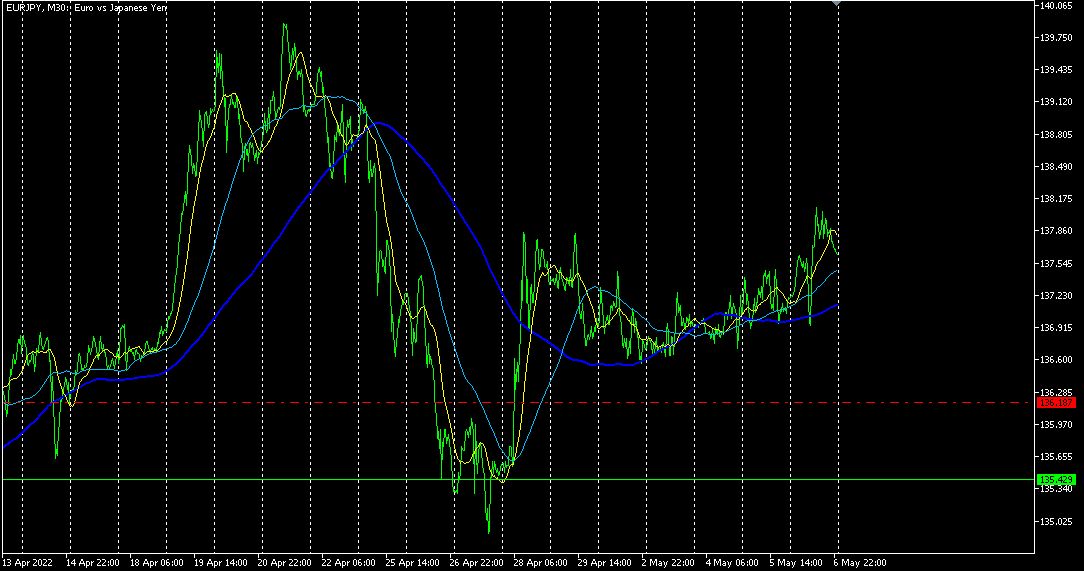
It seems to be moving slightly upward, butSMA200 has a nearly flat slope, so there is no clear direction, and future direction is unknown.
Using the “8CP Visualization Indicator”AnyCP version, I compared USDJPY, EURJPY, EURUSD across three currency pairs.
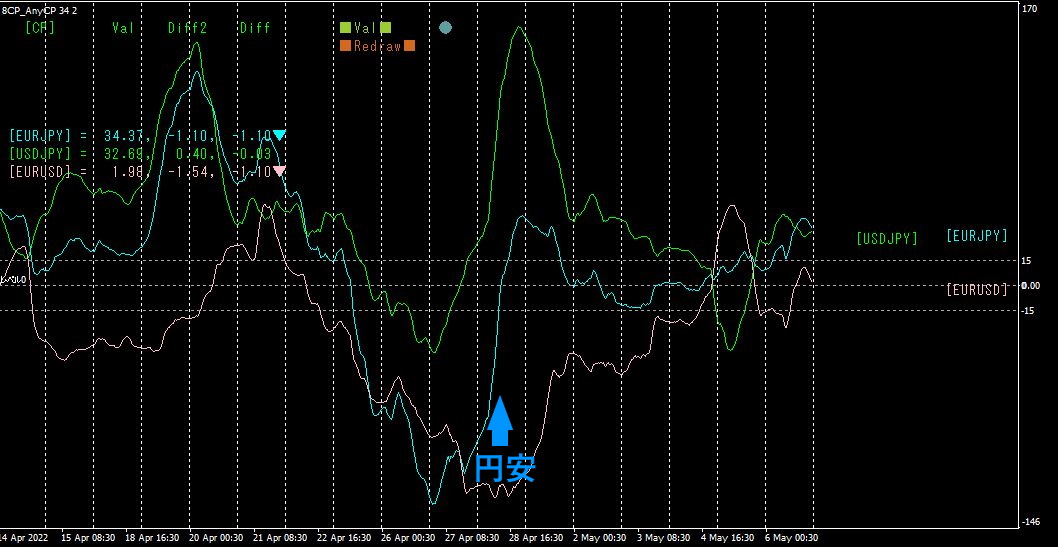
4 Month28 Day,USDJPY also EURJPY both rose. The currencyJPY weakened as a result.
(This is due to yen depreciation.) There are signs of slight yen weakness in the latest chart, but not very pronounced. The lack of directional clarity can also be read from the three-currency-pair relative chart.
【My products for sale】


