

The US employment statistics market will look like this
<5/6 Tokyo Dollar-Yen Developments> (As of 8:20)
We resume posting today, thank you for your cooperation.
From 4/28 in NY to 5/5 in NY, the dollar/yen markets were volatile, but by the end they seem to return to the Tokyo level of 4/28, and the overseas market was just a go-and-return scenario.
In investing, we sold when the price fell below the bottom point, bought at the bottom, and bought on a breakout above the top point—JoyTech’s basic investing allowed easy profit taking in the four days.
Volatile and rough markets have long been JoyTech’s number one revenue source.
The view for 5/6 in Tokyo is simple.
”Bottom zone” 129.80 = 130.05 is the downside limit zone; above is the “upper zone” 130.55 = 65, within which it will move.
(1)The upper zone 130.55 = 65: an upside breakout attempt will face resistance and trade within the high range until the end of the week
(1)The upper zone 130.55 = 65: an upside breakout attempt will face resistance and trade within the high range until the end of the week
(2)The bottom zone 129.80 = 130.05: a bottom attempt will be supported and bought back, ending the week above
(3)Both upside and downside attempts end half-heartedly, with a maximum range of around 130.10 = 50, trading within that zone until the end of the week
With expectations, we anticipate pattern (1).
And if this framework holds and Tokyo concludes, tonightthe US jobs report results will not become a strong dollar-buying factor, with the maximum “monthly point zone” up to 129.95 = 131.10.
The development zone is up to a maximum of 130.10 = 131.10, so it likely will not be a strong downside factor.
It’s a monthly festival market; go boldly. Whether you win or lose depends on Tokyo’s results.
<5/6 Tokyo Dollar-Yen Analysis Chart>
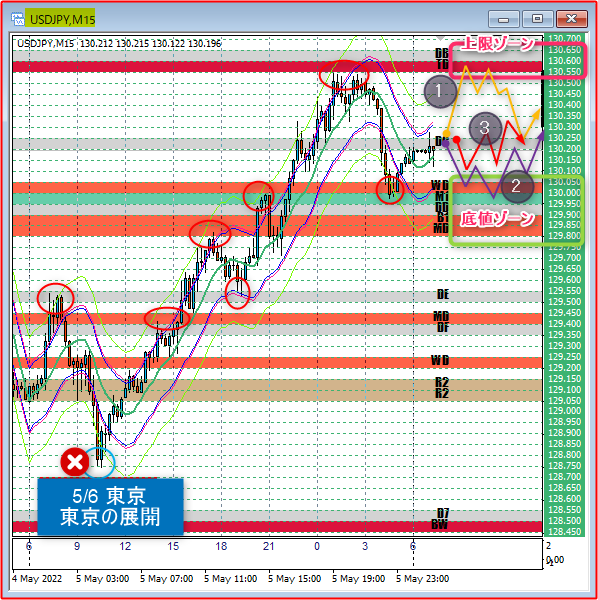
5/6 Tokyo’s “analysis chart”
× ![]()


