⭐️⭐️⭐️ Ginkan (銀漢) 【Today’s winning shape】
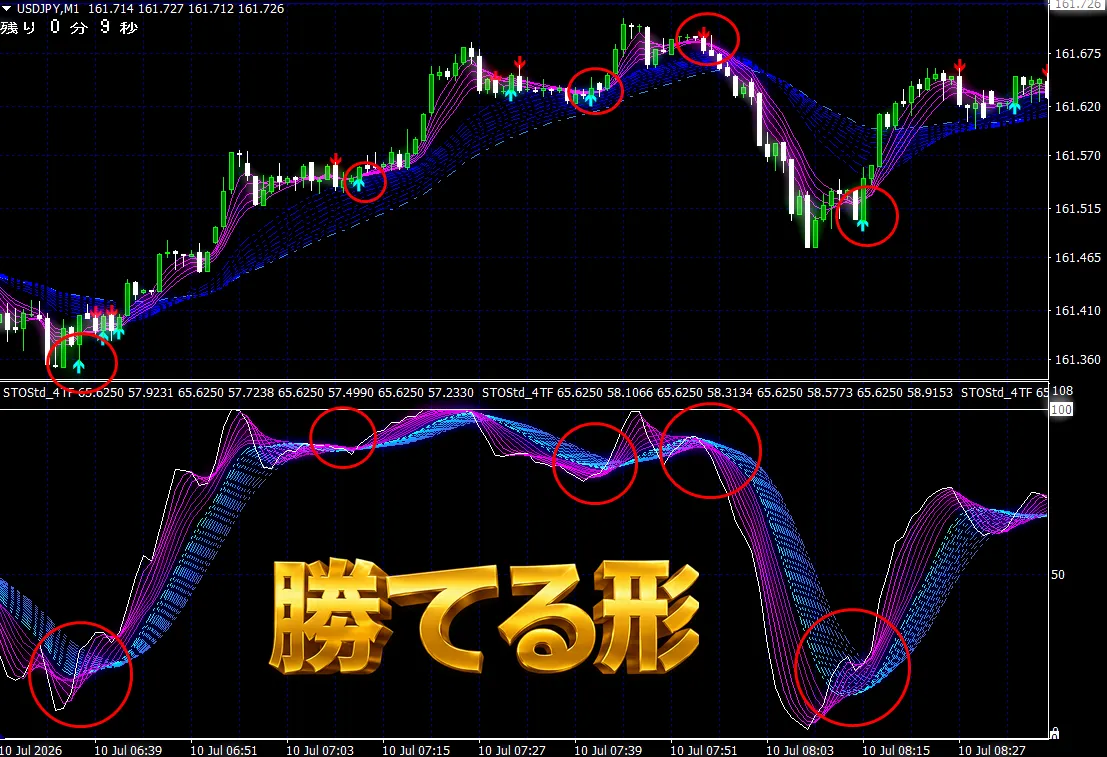
July 10 Ginkan(銀漢)USDJPY1 minute chart
![]()
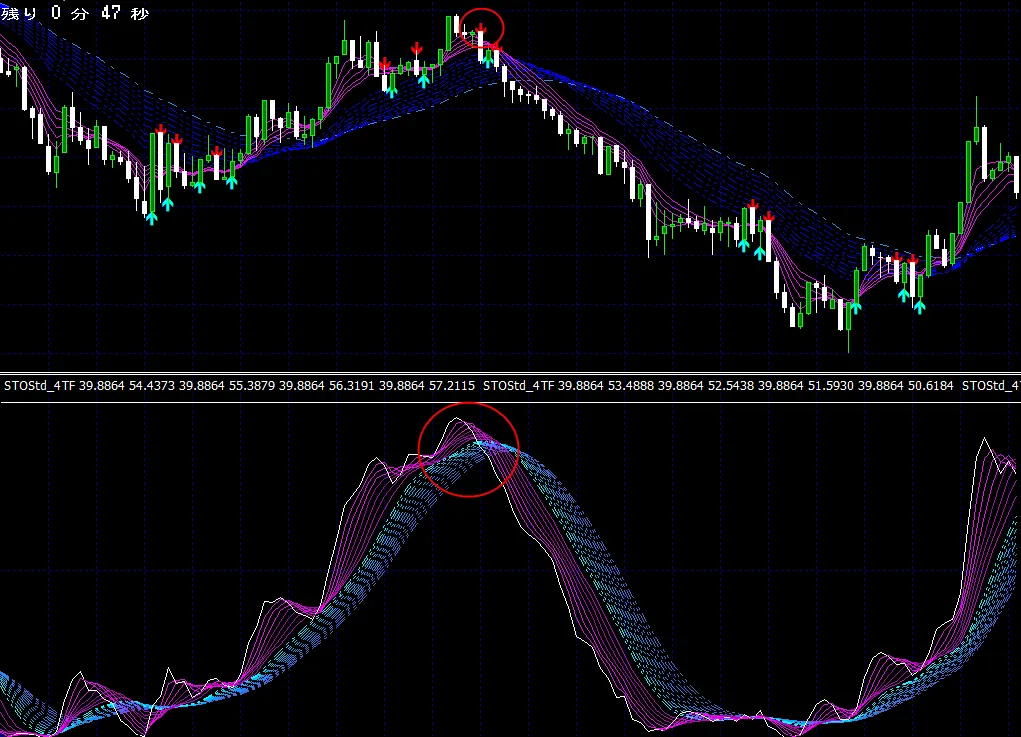
Lower sub-screen: The shape of the indicator inside the red circle is the “winning shape.”
July 10 Ginkan(銀漢)USDJPY1 minute chart
Ginkan (Gingan)
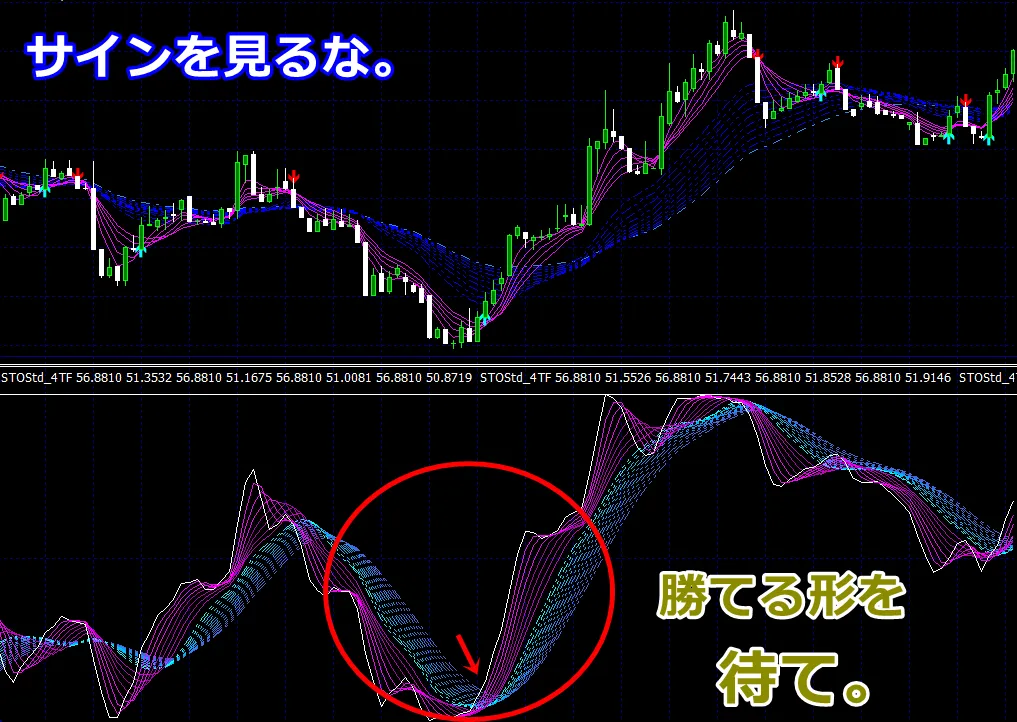
◆ Do not look at the signal. Wait for the winning shape.
Most traders jump in on a “signal.”
Ginkan teaches the idea of “wait until the winning shape is formed.”
Many traders think they should enter when a signal appears.
But Ginkan teaches the opposite.
A signal is only a potential entry.
What really matters is the moment the “winning shape” is formed and breaks through the galaxy belt.
First, I will share that mindset.
◆ Do not enter on a signal.
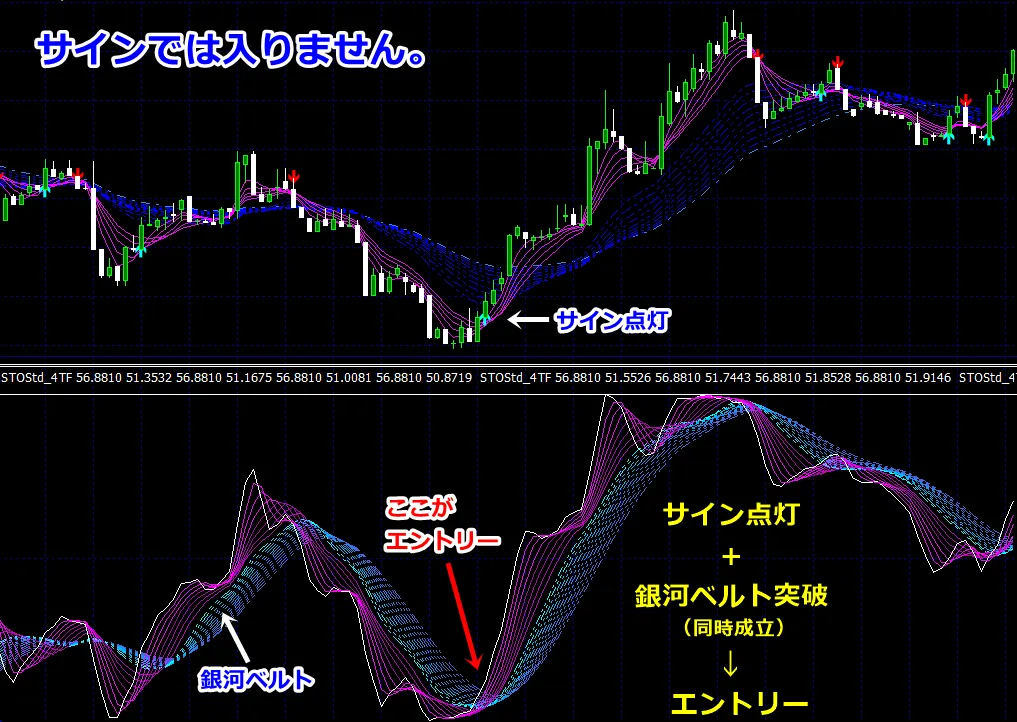
Many indicators assume entry at the moment a signal lights up.
However, Ginkan is different. A signal is only an entry candidate.
“Signal on” and “Galaxy Belt breakout” must
occur simultaneouslyto enter.
Therefore, you skip unnecessary signals and
reduce false moves.
◆ Why only signals aren’t used for entry?
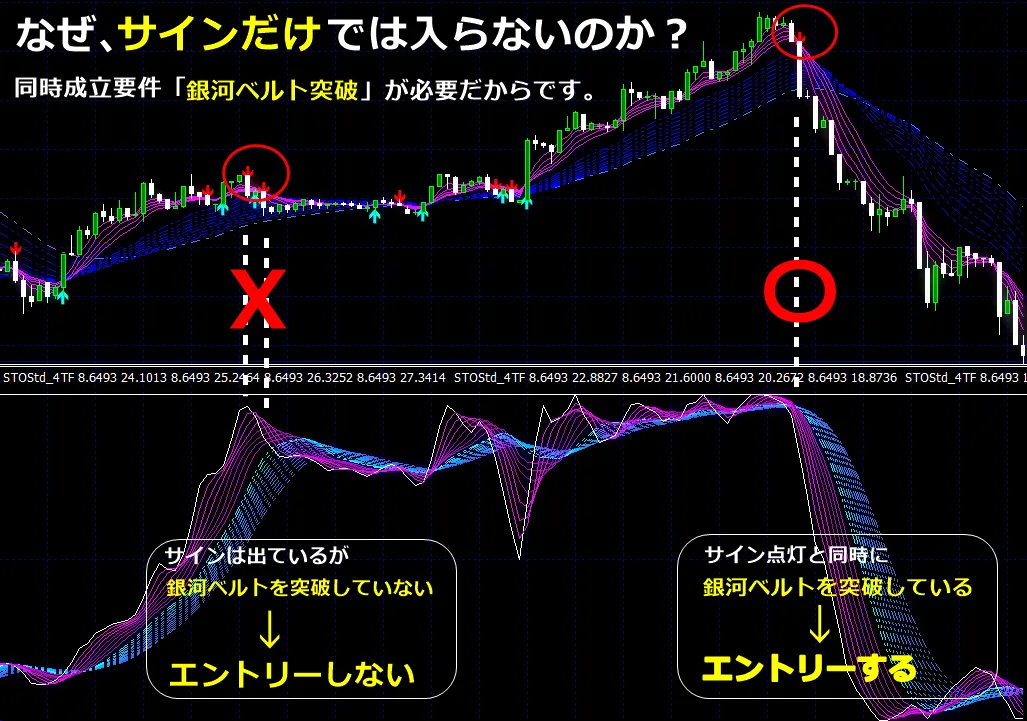
Signals flash many times in ranging markets.
If you jump on them, you end up with many unnecessary entries.
Ginkan
signals light up
and
Galaxy Belt breakout
are only entered when they occur together.
So you can reduce pointless trades.
◆ The losers enter at every signal; winners wait for the winning shape.
Winners wait only for the winning shape.
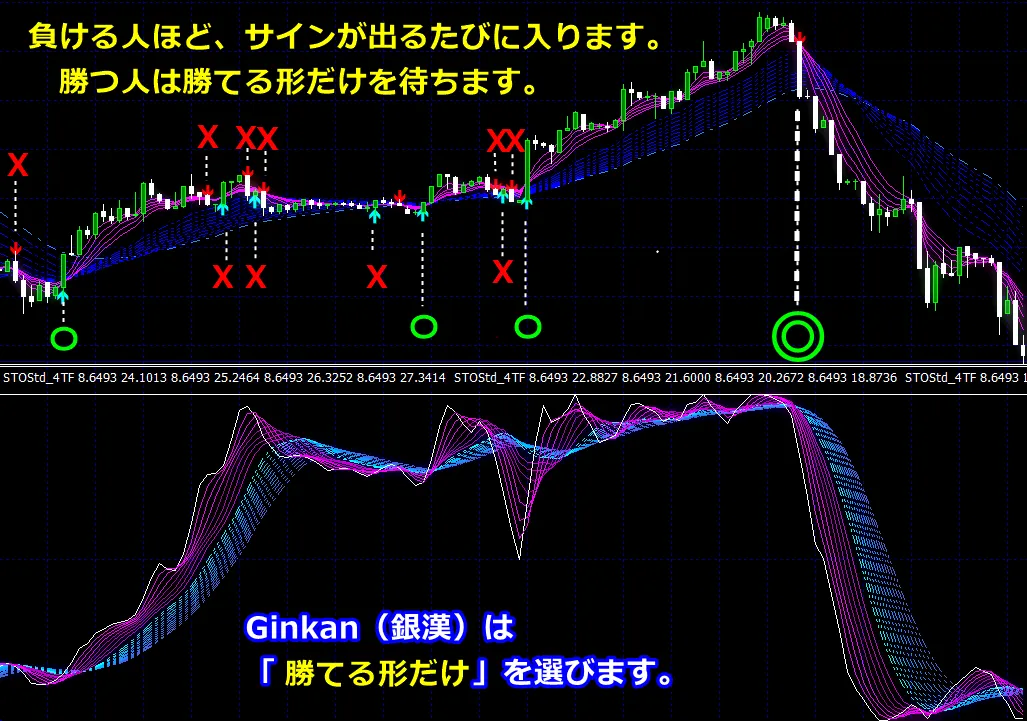
What Ginkan does is
select only signals that become winning shapes.
By discarding unnecessary signals,
you can focus only on the truly target moments.
Would you reproduce this “winning shape” on your chart?
◆ The winning shapes are these two.
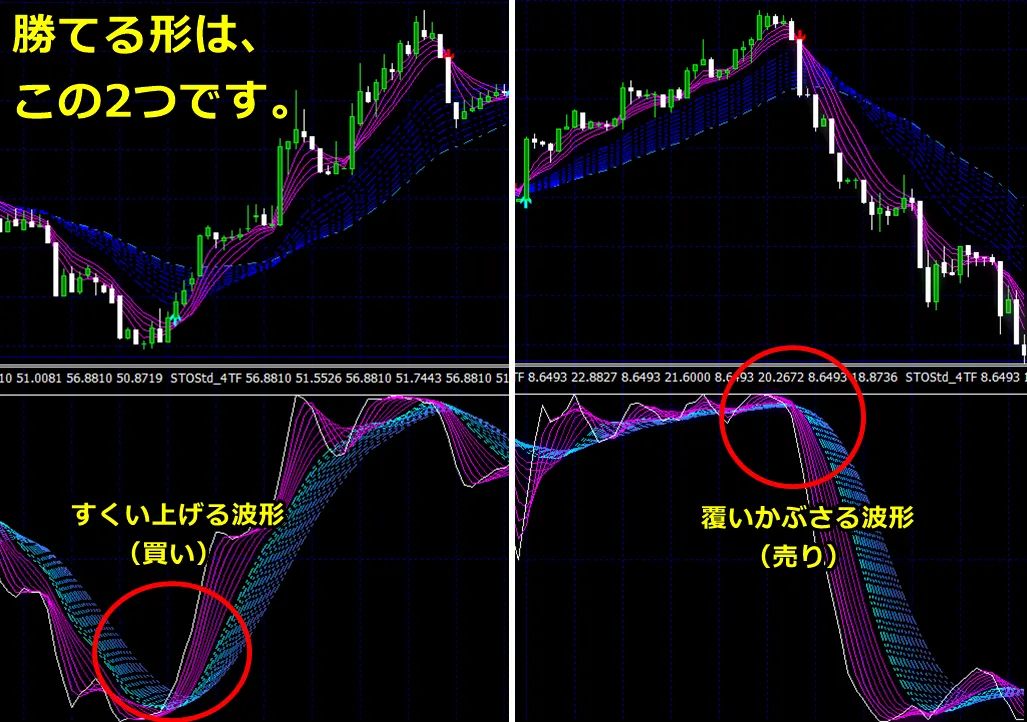
What Ginkan watches is
not signals.
Waveforms.
There are only two shapes to memorize.
■ Buy
Rising waves
■ Sell
Overwhelming waves
If you memorize only these two waveforms,
your chart-reading perspective changes.
Example 1Rising waveform
The pink band reverses as if scooping up the Galaxy Belt from below.
When the signal lights up, break through the Galaxy Belt,
and enter a buy.
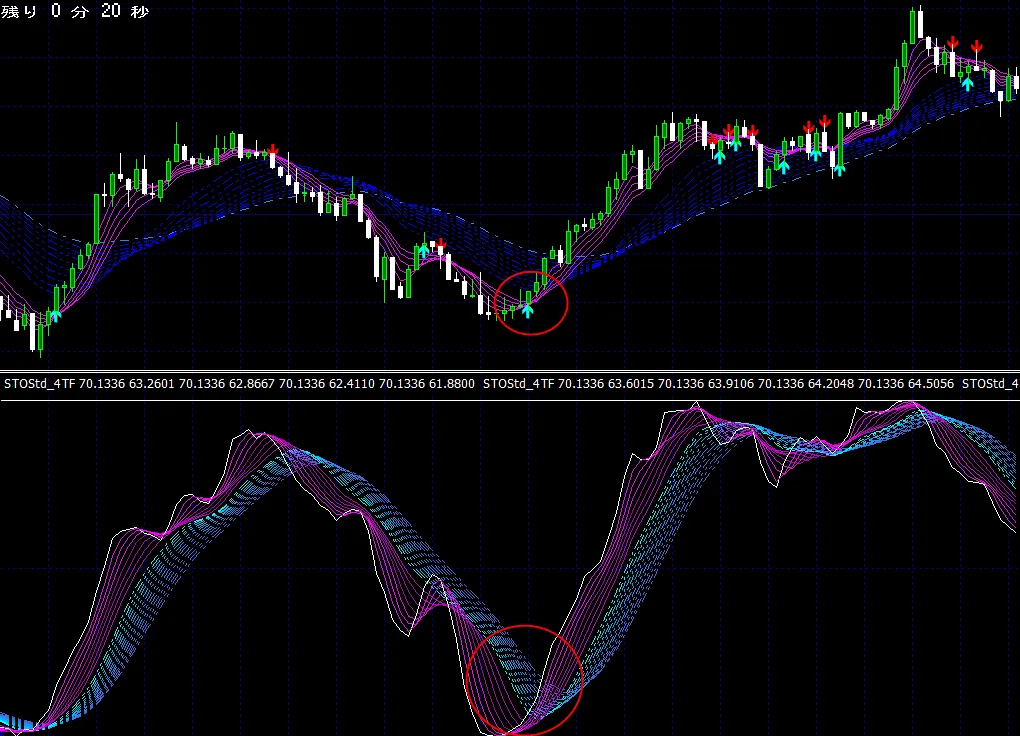
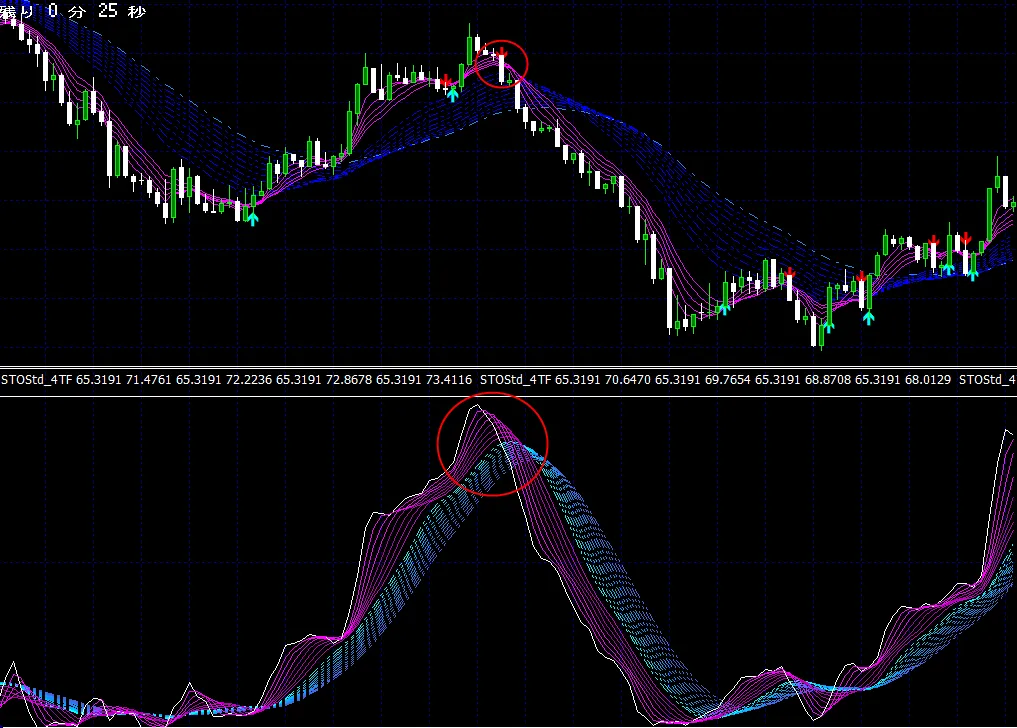
Example 2Rising waveform
The same waveform appears
even if the currency pair changes,
even if the time frame changes,
repeatedly.
So it can be reproduced.
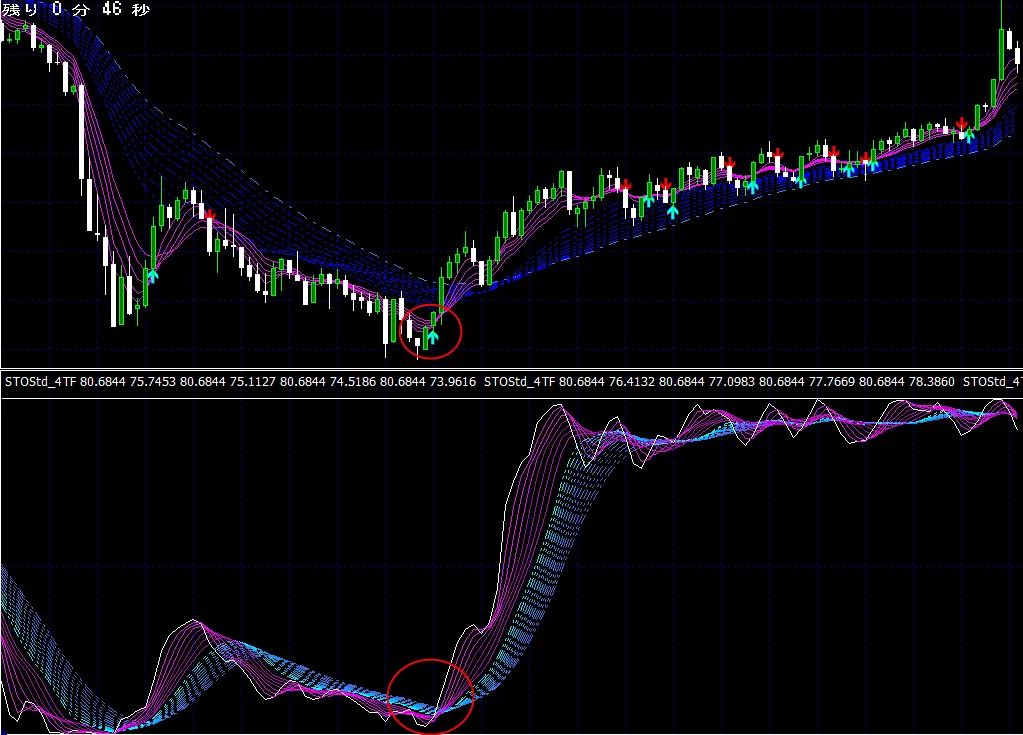
Example 3Rising waveform
It is not by chance.
Winning shapes share common waveforms.
Ginkan (Gingan) targets only those waveforms.
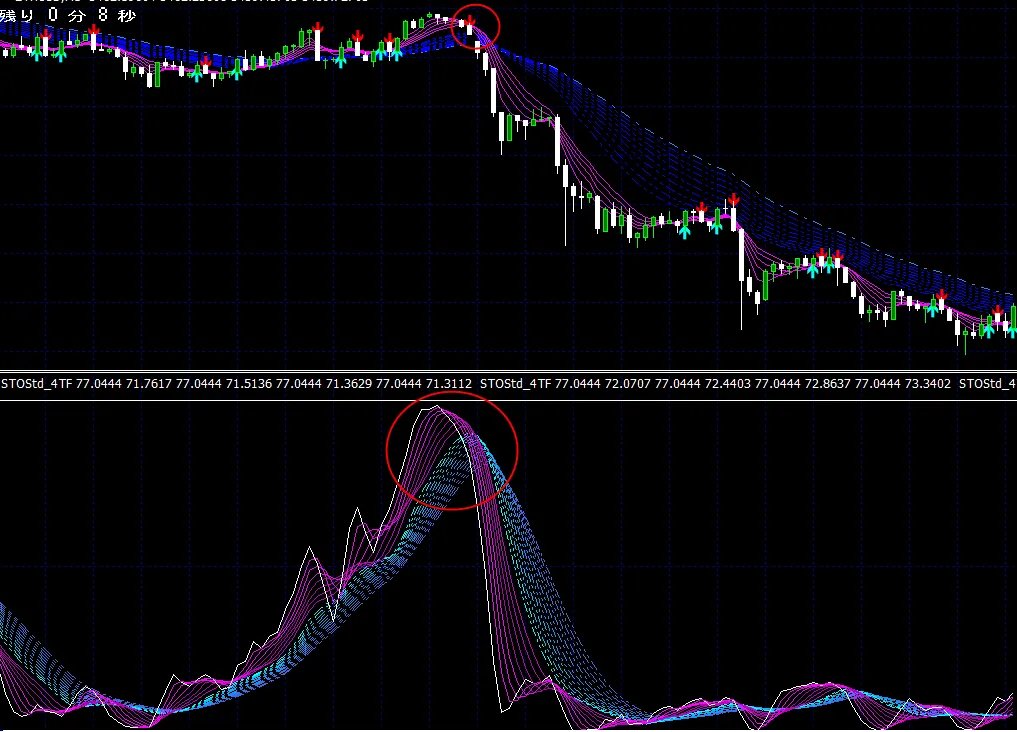
Example 4Overwhelming waveform
The pink band reverses as if covering Galaxy Belt from above.
This is a representative sell entry.
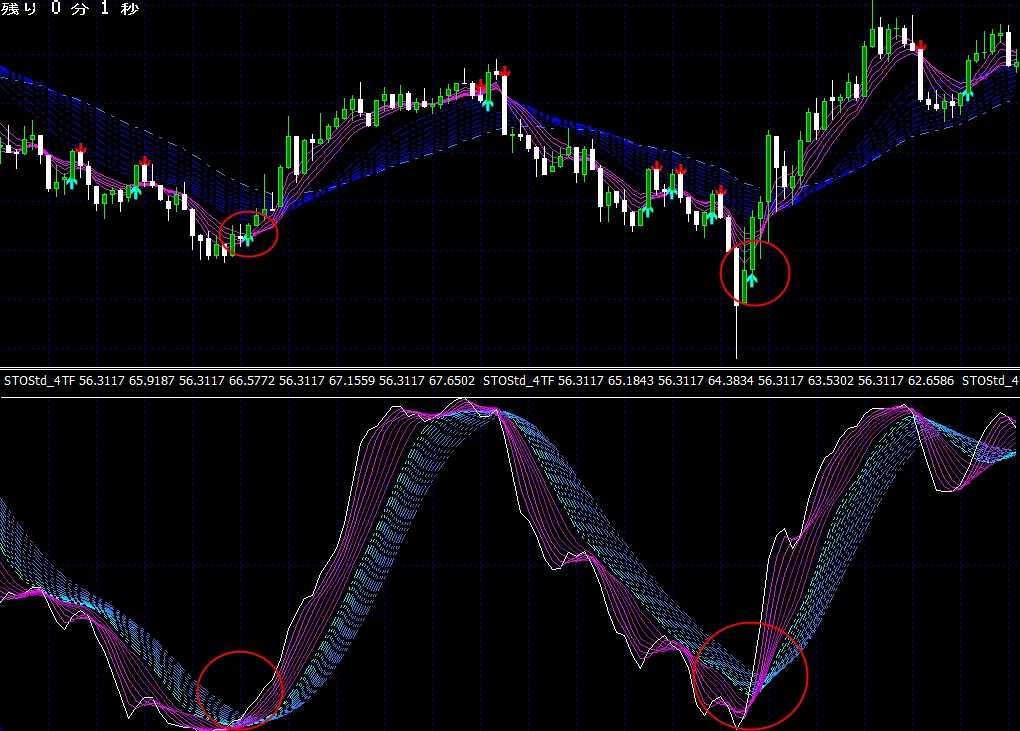
Example 5Overwhelming waveform
Winning shapes apply to both buy and sell.
Only the direction differs.
Example 6Overwhelming waveform
Ginkan (Gingan) does not chase signals.
Therefore, you reduce unnecessary entries and
accumulate profits.
◆ The winning shape leads to results.
Ginkan is not a tool to chase signals.
By waiting for the “winning shape,” you reduce unnecessary entries and, as a result, achieve a high win rate.
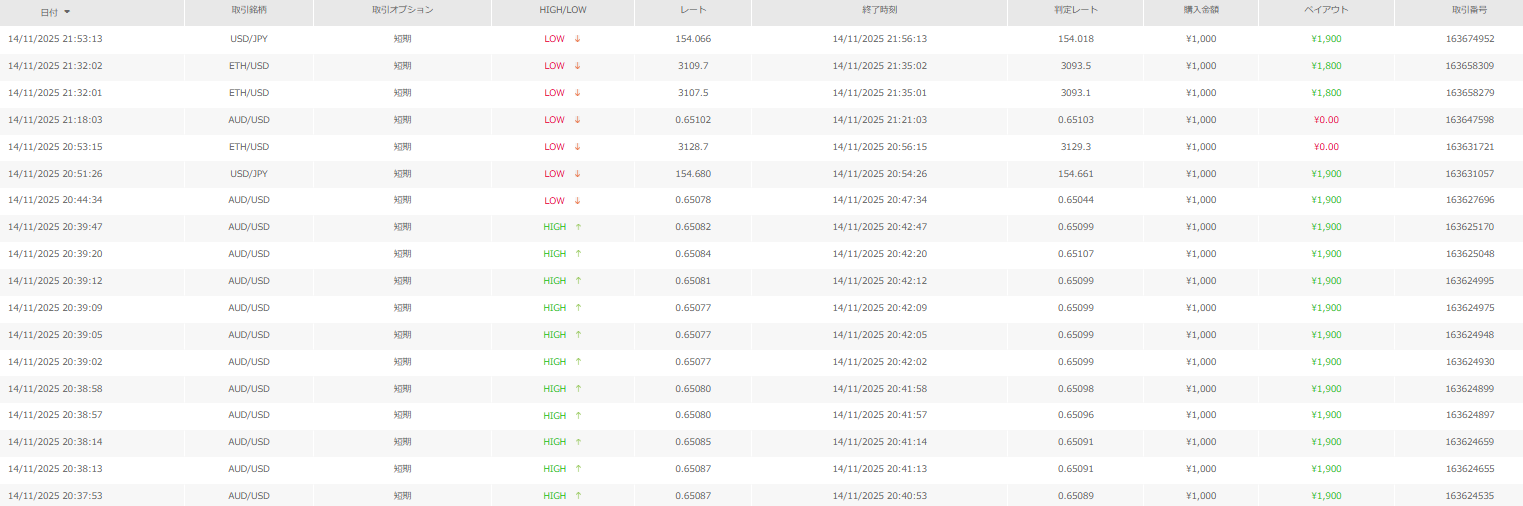
As an example, here are trading records from binary options (3-minute trades).
26 wins 3 losses (win rate 89.6%)
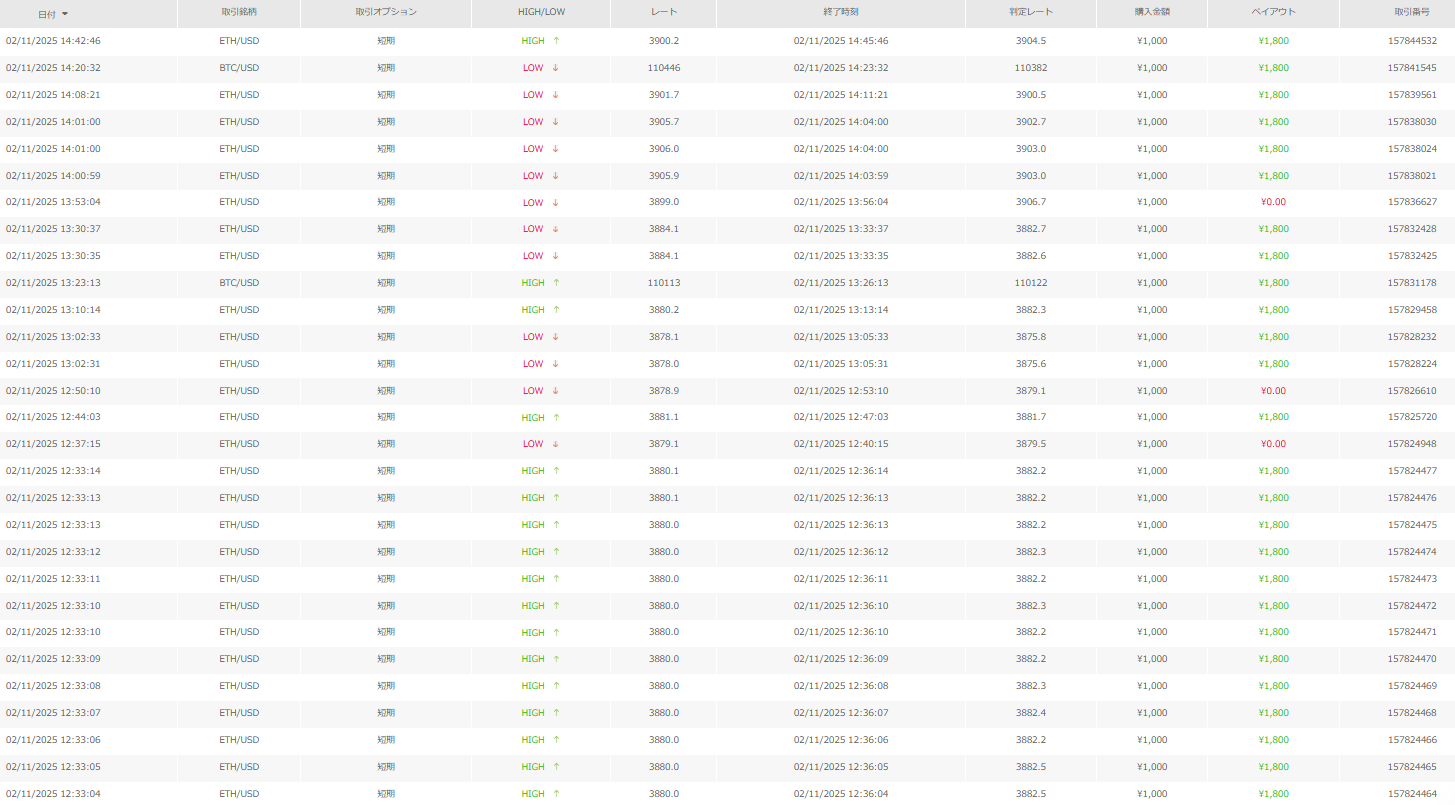
15 wins 1 loss (win rate 93.7%)
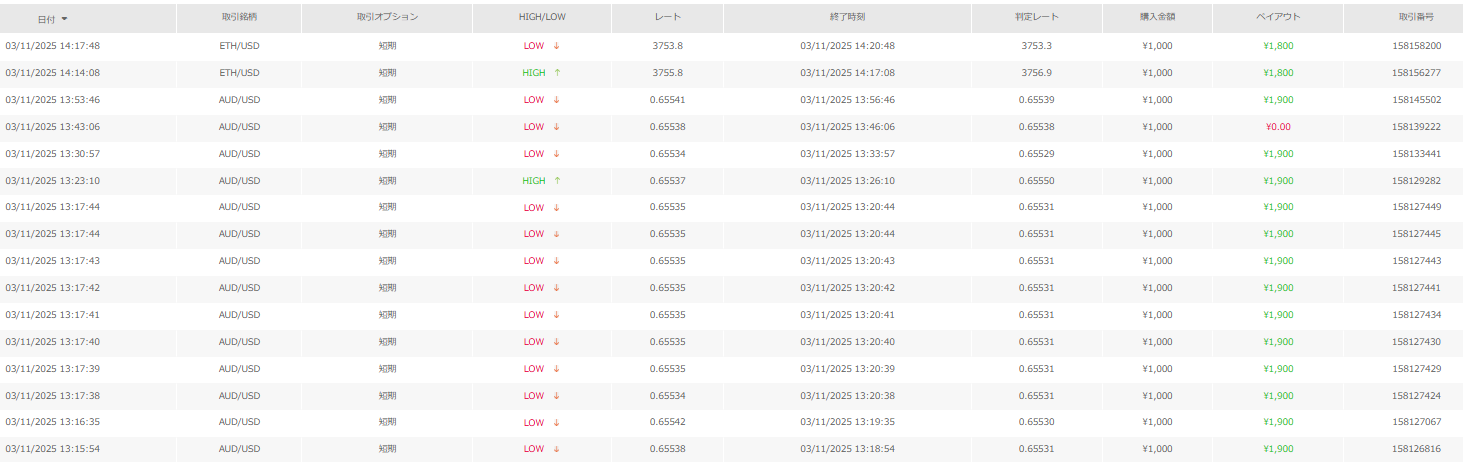
19 wins 3 losses (win rate 86.3%)
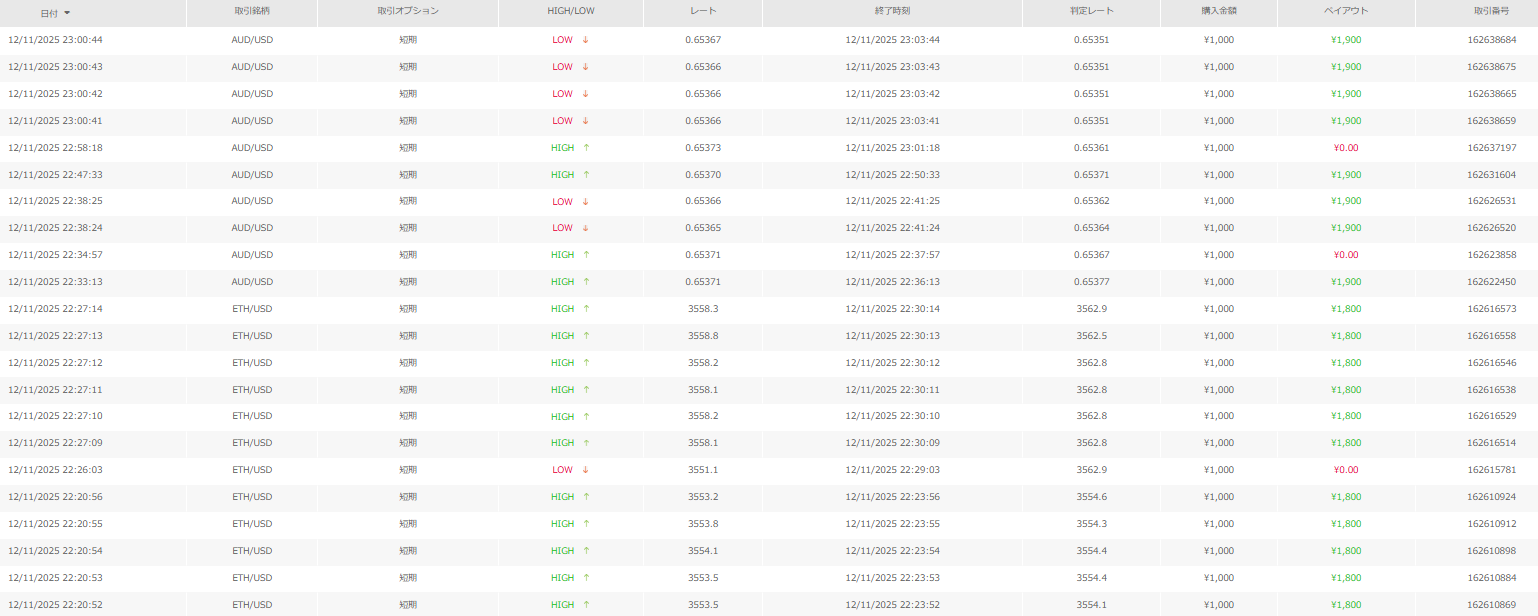
26 wins 4 losses (win rate 86.6%)
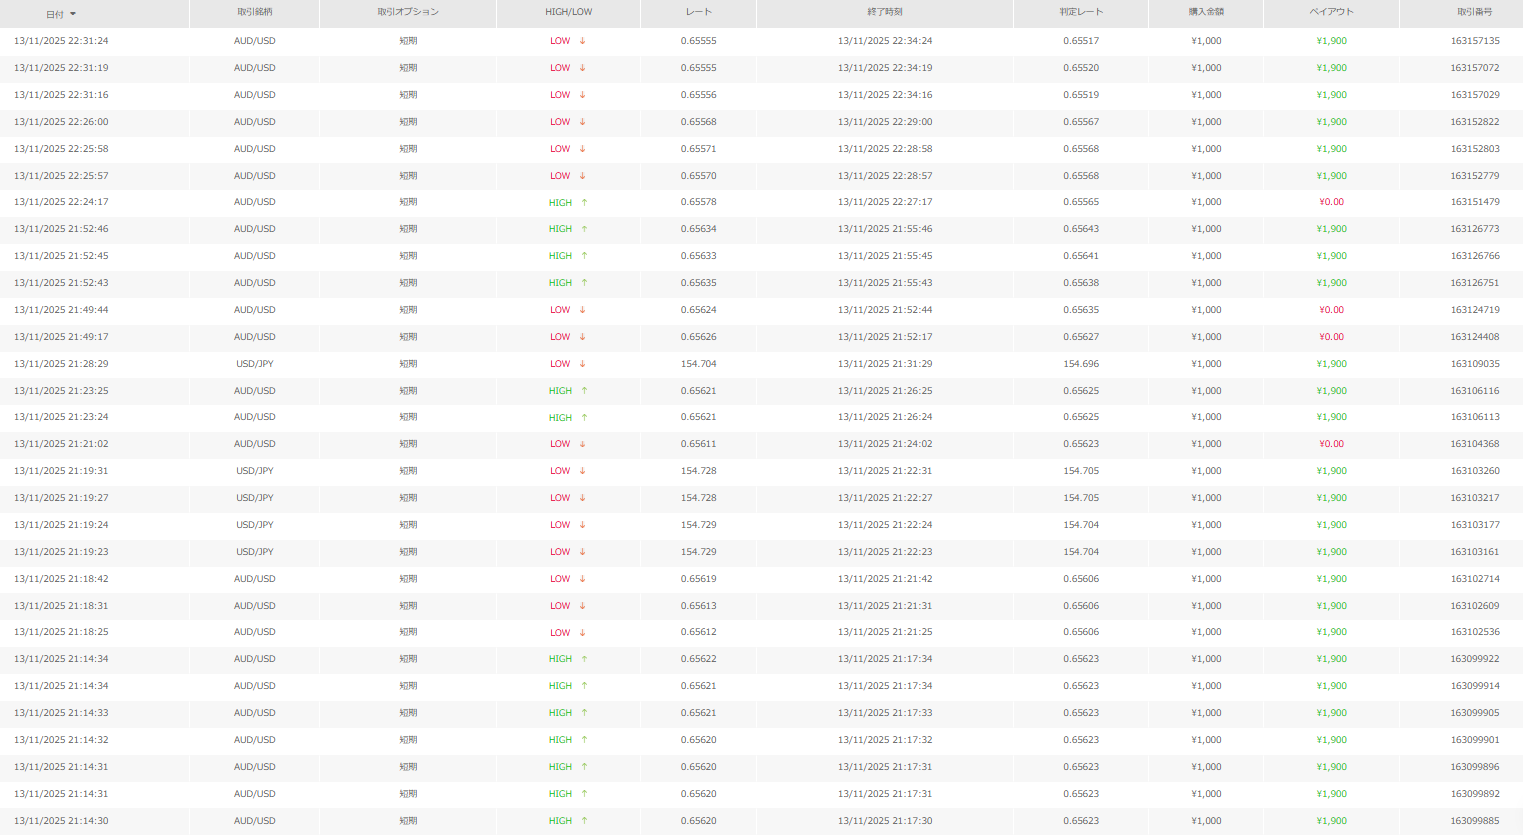
16 wins 2 losses (win rate 88.8%)
Not signals, but see the “winning shape.”
That perspective will change your trading.
◆ Have you ever experienced this?
Chasing a signal,
thinking you’d win, you jump in.
If you identify with this,
◆ Message from the developer
I continue daily market validation and work on improving Ginkan.
I want this to be a discretionary support tool you can use for a long time, not a product that ends after selling.
Therefore, I also share daily validation results and how to use it.
Within GogoJungle,“Investment Navigator Plus”is whereevery day
we publish
the “winning shape.”
◆ Frequently Asked Questions
Q. Recommended currency pairs?
A. It can be used with all currency pairs shown in MT4.
Q. Recommended time frame?
A. It supports all time frames from 1 minute to monthly.
Q. Can beginners use it?
A. Yes. It’s developed to simplify entry decisions.
Q. Will it repaint?
A. It does not repaint.
☆ The winning shape is visible only to those who wait. ☆