

Utilization of the "Visualization Indicator" (Part 40)
Use of the "Visualizing Indicator" (its40)
1. Further advance the "28 Currency Pair List Indicator" and develop the indicator
“8CPVisualizing Indicator”to drawUSDJPY.
There are versions of the “8CPVisualizing Indicator”Oceania edition,London edition,NewYork edition,AnyCP edition. This time, we used theLondon edition.
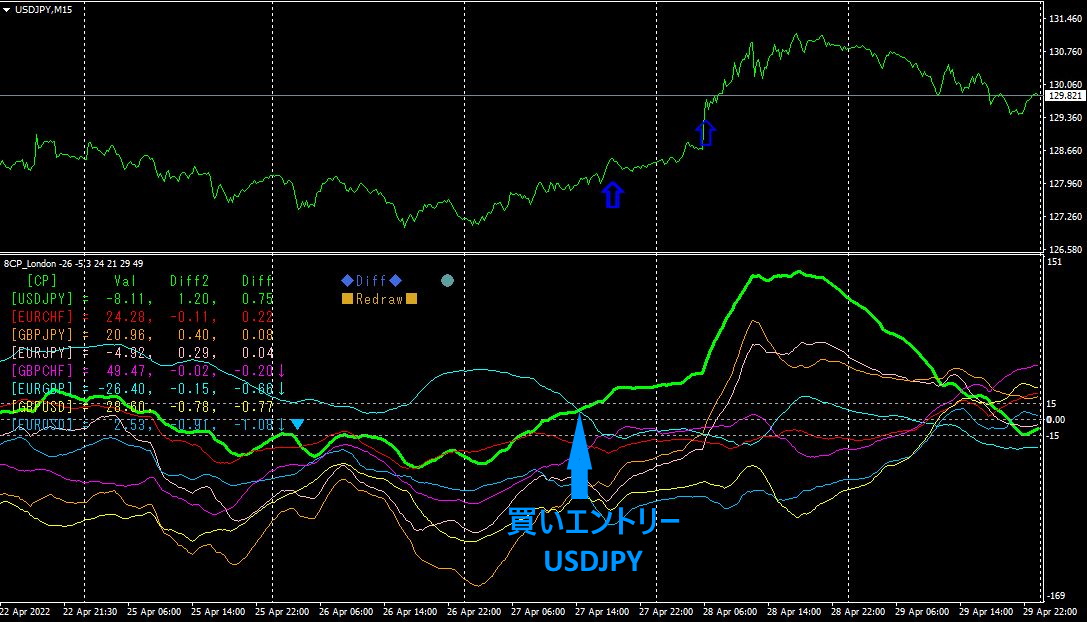
The upper half is theUSDJPY 15-minute chart.
The lower half is the “8CPVisualizing Indicator.” The light blue thick line graph corresponds toUSDJPY.
On Wednesday, buy entries appeared for both the “28 Currency Pair List Indicator” and the “8CPVisualizing Indicator.” If you buyUSDJPY here,300PIPS or more in profit was obtained.
Still, the behavior ofUSDJPY during this period is strange. It seems to be being buffeted by the wave of yen weakness.
2. Best SelectTry the Indicator
4Month28 day 12:29 shows on the screen displayed by the 28CP Best
Select Indicator.
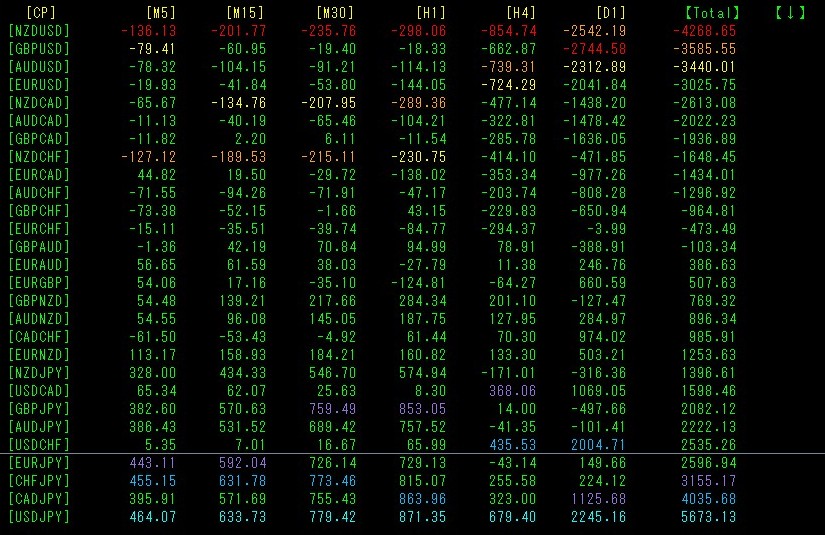
[Total]is sorted in ascending order. Look at the USDJPY value on the bottom line. Remarkably,USDJPY shows in all timeframes: [M5][M15][M30][H1][H4][D1][Total] with light blue display across all timeframes! Moreover,[Total] shows a positive value of5673.13. Since a strong uptrend is present on all timeframes, this is clearly a signal to buy.
If LINE notification is turnedON, you will receive messages like the following.
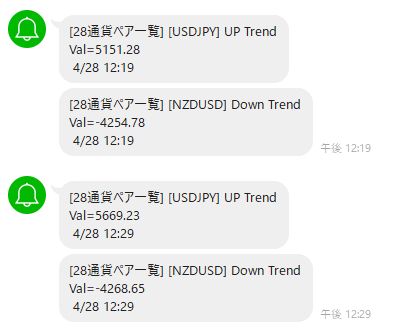
Every 10 minutes,LINE alerts are sent. Looking into the alert details,USDJPY is UP Trend,Val value was,,,,, increasing. This shows the uptrend gaining momentum.
Meanwhile,NZDUSD is Down Trend, but the negative value is-4254.78 to-4268.65 increasing. From these, it is easy to conclude that you should buy and sellNZDUSD.
15-minute chart
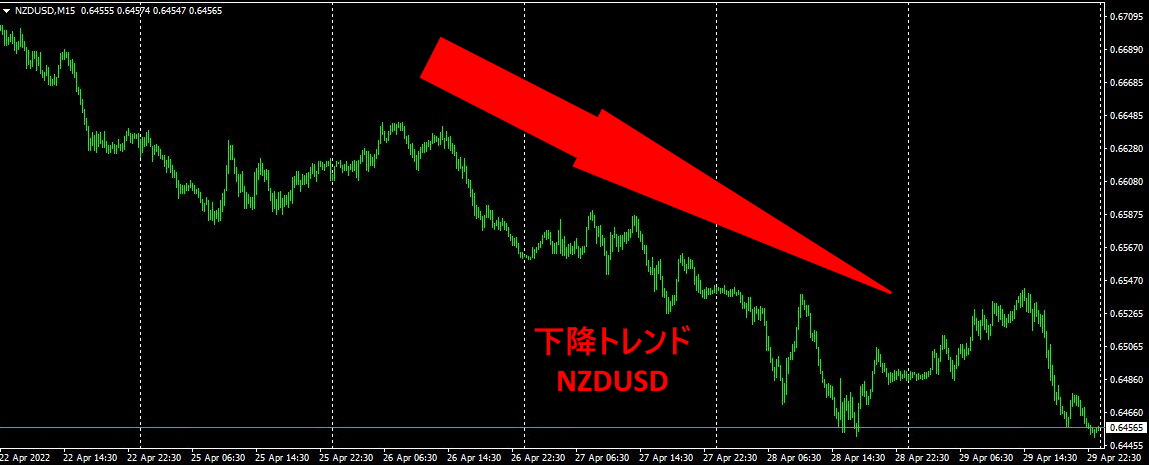
By using the“28CP Best Select Indicator,” which currency pair is in the strongest uptrend and which is in the strongest downtrend, and which currency pair to trade will be clearly guided.
3. Since last year5 month, how did EURJPY move?
From 2021 year5 month, we have been tracking EURJPY.
To view the overall trend, a 30-minute chart covering about the last three weeks is drawn.
Previously, I wrote the following.
Rather than falling as I had expected, it rose further. It seems to be directly influenced by the rapid yen depreciation during this period. Chart-wise, I thought it might start to fall soon, but4月19日’s cross-yen synchronized rise pushed it up. If yen weakness continues further, what will the rate be?
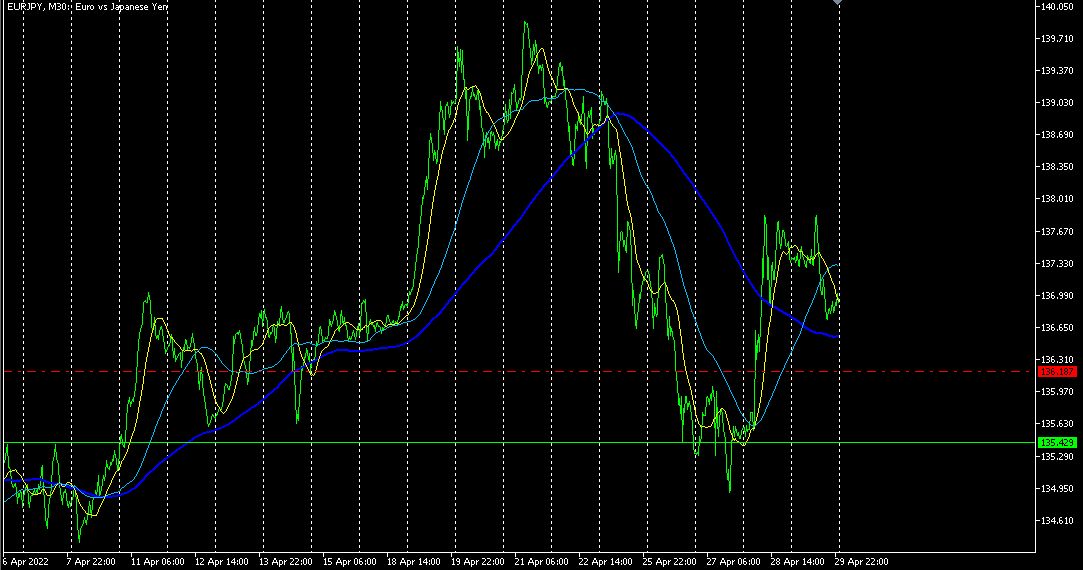
It has fallen. Dollar/yen briefly exceeded 130 yen, but EURJPY could not exceed the previous high. This indicates the uptrend that had continued has ended. Now, let's aim for a decline—break the double top neckline, etc.
【My listed products】


