

Utilization of "Visualization Indicators" (Part 39)
Utilization of the "Visualization Indicator" (Part39)
1. Further evolve the "28 Currency Pair List Indicator" into an indicator
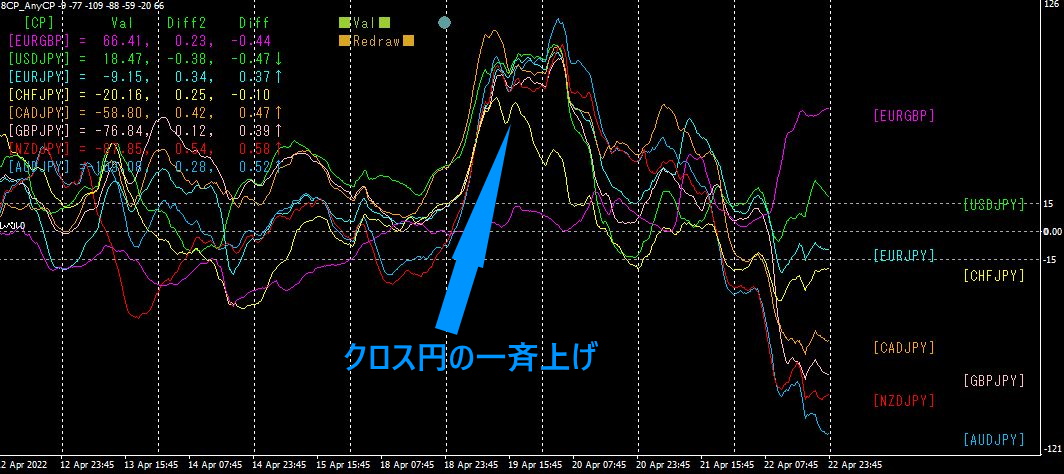
“8CP Visualization Indicator”to draw CADJPY
The “8CP Visualization Indicator” includesOceania version,London version,NewYork version, version.AnyCP version. This time, we used theNewYork
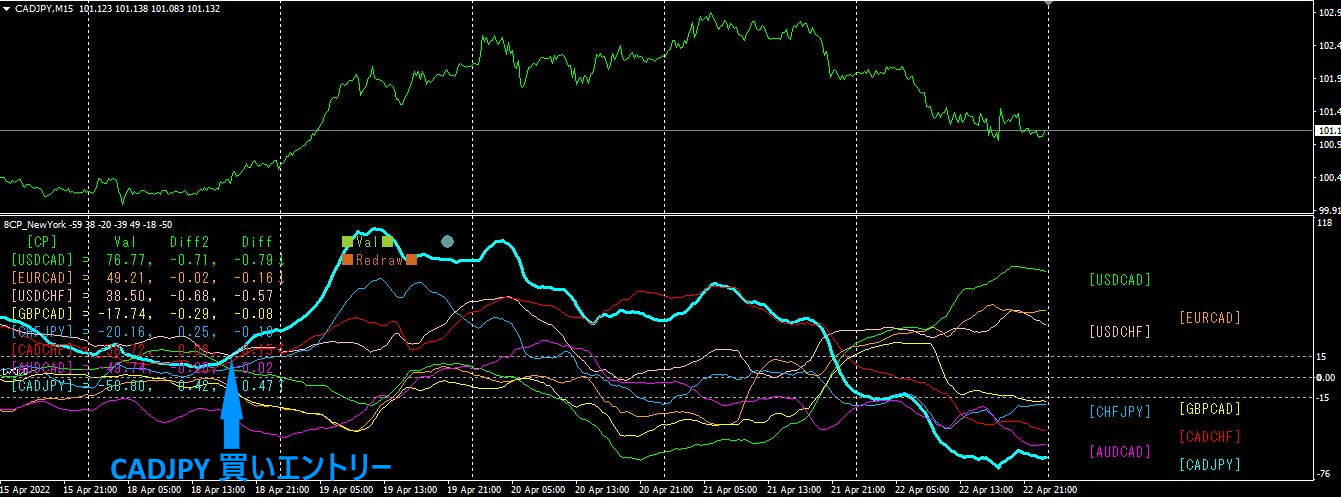
The top half is a 15-minute chart ofCADJPY.
The bottom half is the “8CP Visualization Indicator.” The blue thick-line graph corresponds toCADJPY.
On Monday, if you bought CADJPY at the entry point of the “8CP Visualization Indicator,” you could gain more than200PIPS in profit.
2. Best SelectTry the Indicator
4Month19Day11:50— the screen shown was displayed with the28CP Best SelectIndicator.
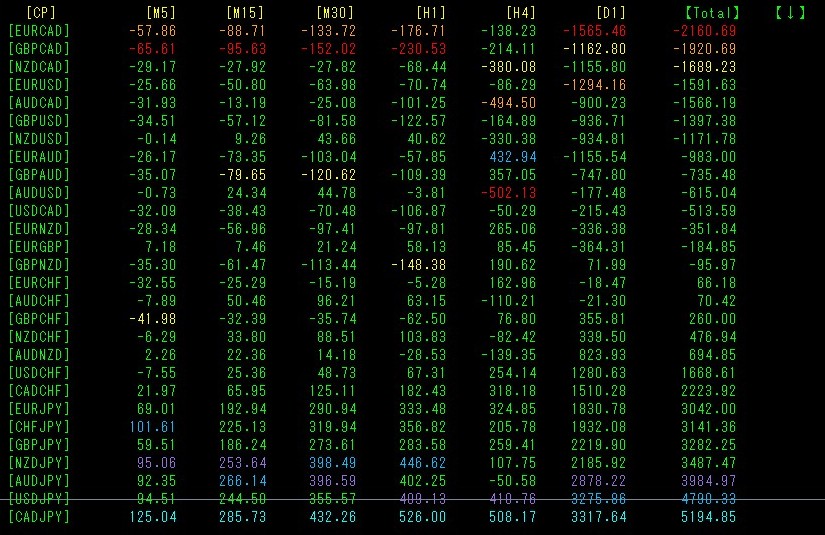
[Total]is sorted in ascending order. Look at the CADJPY value on the bottom row. Remarkably, for all time frames [M5][M15][M30][H1][H4][D1][Total], it is displayed in blue. Furthermore, using the [Total] value, it shows 5194.85 as a positive figure. Since there is a strong uptrend across all timeframes, this is essentially a buy signal.
LINE notification feature isON, you will receive messages like the following.
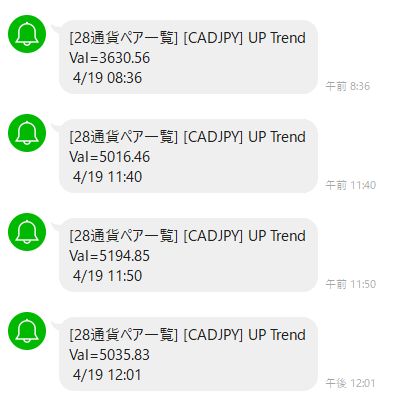
You can also confirm that a LINE notification for CADJPY has been arriving from an earlier time.
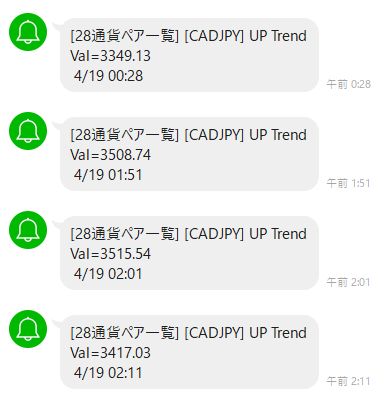
If the evaluation value exceeds 3500 and notifications arrive consecutively for a currency pair, it is likely to yield good results.
With the “28CP Best SelectIndicator, currency pairs can be analyzed to identify which pair has the strongest uptrend, which has the strongest downtrend, and which pair to trade.
3. Since May last year5,EURJPY has been tracked. What has happened?
Since 2021 Year5 MonthEURJPY movements are being tracked.
To see the overall trend, a 30-minute chart showing roughly the last3 weeks is drawn.
Previously, I wrote the following.
Indeed, as it has risen this much, the weekly upper price band is near, so further upside is difficult. I will view from a downside perspective, and sell if it goes down.
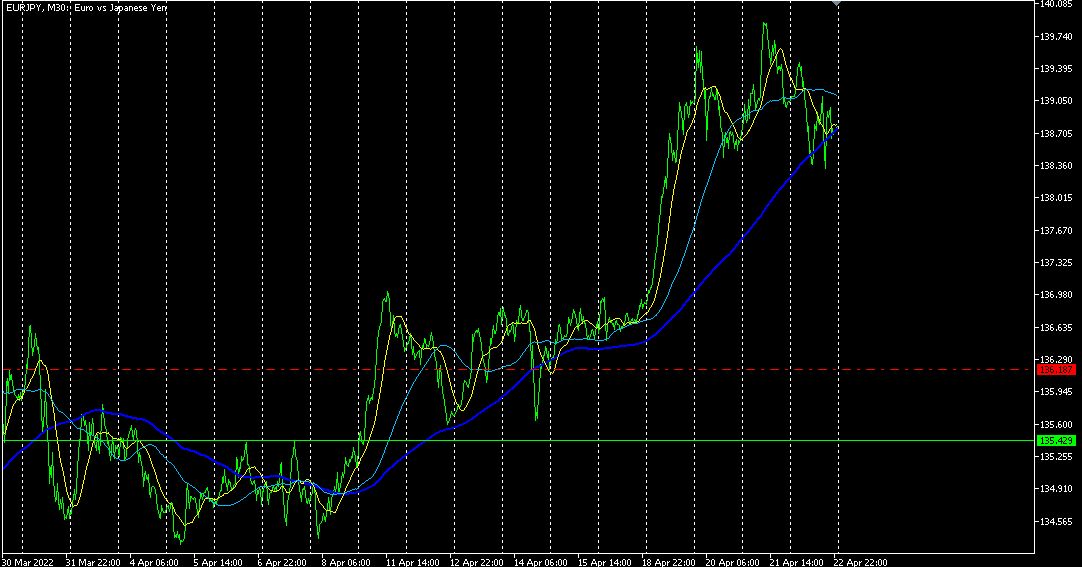
Contrary to the expectation of a drop, it rose further. It seems to be directly affected by the rapid yen depreciation in this period. Chart-wise, I thought it might soon turn down, but4 month19 cross-yen surge caused the rise. If yen depreciation continues, what will the rate be?
【My Items for Sale】


