

The entry chance is 10 to 100 times per day for the <1-minute chart indicator>

<Procedures are easy with steps ①②!>
In an uptrend,


<Procedures are easy with steps ①②!>

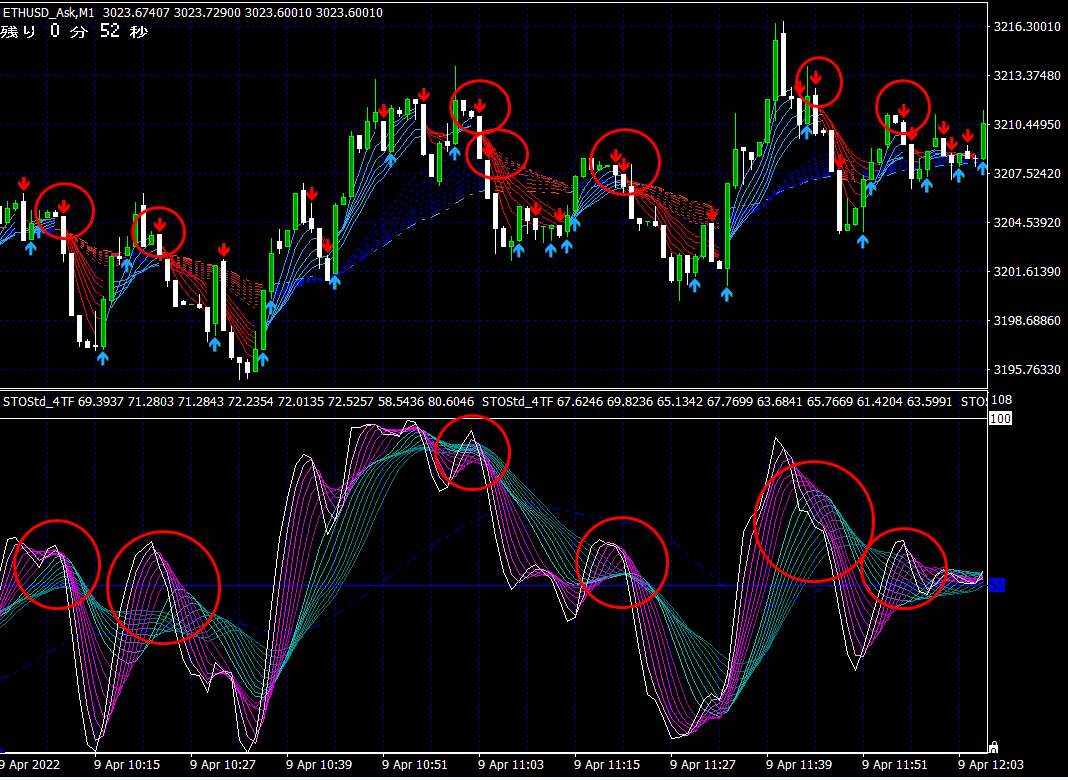

② When the arrow signal is lit, if the pink band of the indicator drops below the lower blank area,then the current candlestick will be confirmed a few seconds before confirmation or just after confirmation for a low-entry on a 1-minute or 3-minute decision.
However, marking points can be used later for learning, so we prepared two types of templates, one with markings for those who wish to use it for study.
~ Display marks at points that form a winning setup! ~
In FX or binary options trading,entry points are everything.If the indicator forms these shapes, it will go up; if it forms another shape, it will go down.
Mastering the idea of a “winning shape” is the first step to becoming a profitable trader.
However, mastering this shape is not as easy as it sounds.
When someone says “this happens, then what happens?” questions arise.
Therefore, at the point where this happens, we attach a marking point
to make it easy for anyone to understand.
※ The turning points for uptrends are ● turning points for downtrends are ●


You can apply the above entry method directly on charts of each timeframe.

◆ Candlestick chart with moving averages
• Each moving average line changes color during uptrends and downtrends. Upward movement turns blue, downward movement turns red.Blue, in downtrends red
• In the upper left corner, remaining seconds until the current candlestick is confirmed「Remaining seconds」is displayed
Short-term band: white and pink
Long-term band: green
- If the white/pink band is above the green band, it indicates an uptrend, conversely
if the white/pink band is below the green band, it indicates a downtrend.
• If the conditions are not met before the candlestick closes, they turn off.No repaint.


