

4/21 Best FX USD/JPY information as an online side business
<4/20 Dollar/Yen results>
Tokyo range: 128.05=129.40, New York range: 127.47=128.28
As expected, I didn’t think we’d approach 130 yen before Golden Week.
That alone shows how persistent the upside struggle was, and in Tokyobreaking below the important monthly point 128.65-70 would not end in a mere pullback but turn into a downside reversal, so we adopted a selling policy across the boardas the stance.
In Tokyo, I would have liked the price to fall a bit more toward the “weekly report’s assumed upper zone” 127.15=65, but it was easily achieved with a 40-pip drop.
Furthermorethe rebound cleanly continued from the monthly point 128.65-70, making the second selling easy.
In New York, there was a solid plunge to the “weekly report’s assumed lower zone,” and both Tokyo and European sharp declines yielded easy, large spreads.
Since I published yesterday, I will also upload the verification chart of the “Weekly Analysis Diagram” today.
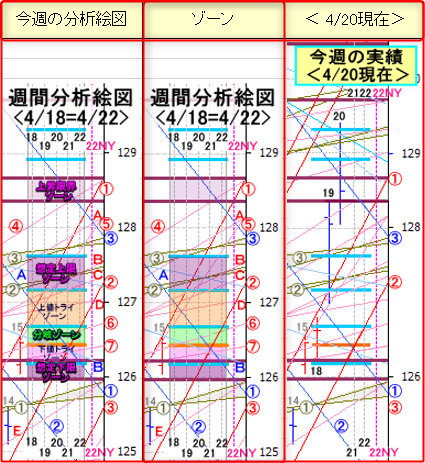
Result on 4/20: “Weekly Analysis Diagram”
<4/21 Tokyo Dollar/Yen>
The view for Tokyo is simple.
Tokyo has fallen to the current market sense’s “bottom zone” 127.60=90.
Therefore, whether a rebound flow can form from this zone is the key point.
Ideal is<Development Pattern (2)>but it’s a bit harsh to expect that; the “divergence zone” 128.30=50 would need to be retraced<Development Pattern (1)>to be seen. It would be an investment-worthy “rebound from testing the bottom.”<Development Pattern (3)>is considered unlikely.
<4/21 Tokyo Dollar/Yen Analysis Diagram>
× ![]()


