

Utilization of "Visualization Indicators" (No. 38)
Use of "Visualization Indicator" (Part38)
1. Further evolve the "28 Currency Pairs List Indicator" into an indicator
"8CPVisualization Indicator"to drawNZDUSD.
The "8CPVisualization Indicator" includesOceania edition,London edition,NewYork edition,AnyCP edition. This time, we used theOceania edition.
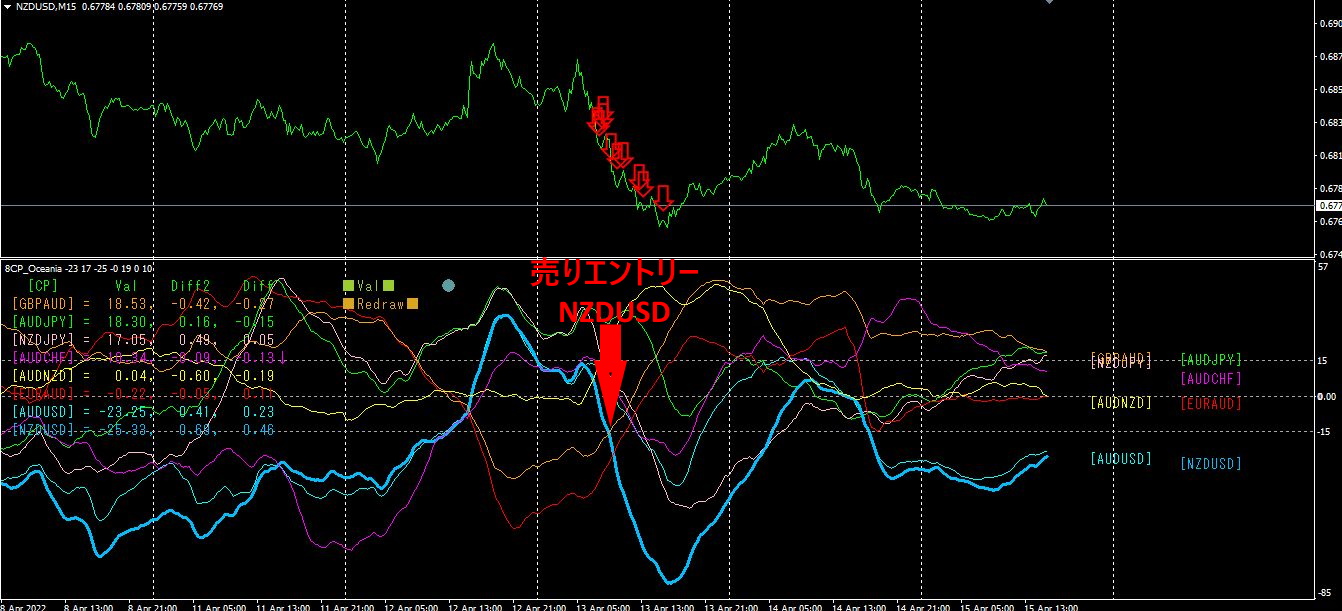
The top half is theNZDUSD 5minute chart.
The red arrows indicate the alert positions of the "28 Currency Pairs List Indicator".
The bottom half is the "8CPVisualization Indicator". The light blue thick line graph corresponds toNZDUSD.
Alerts from the "28 Currency Pairs List Indicator" and the "8CPVisualization Indicator" appear at nearly the same positions. If you had entered a short trade on the alert, the profit would have been about50PIPS.
2. Best SelectTry the indicator
OnMonth14,22:55, the screen shown was displayed with the28CP Best Select
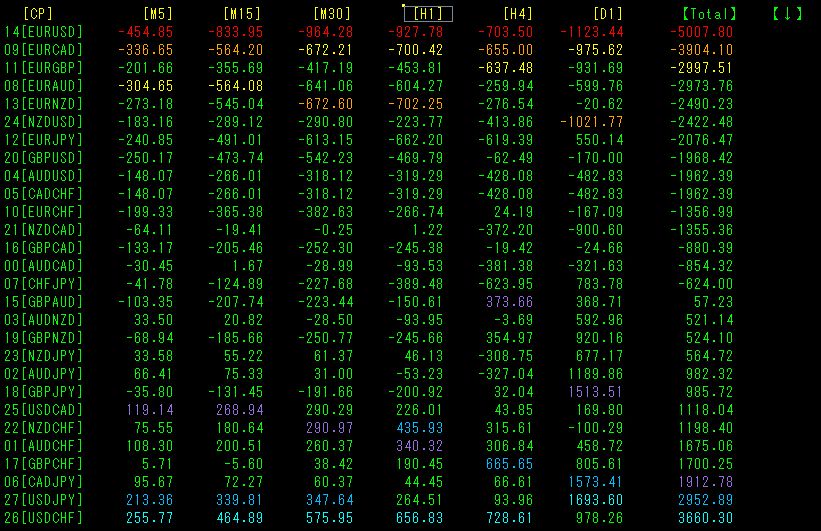
[Total]is sorted in ascending order. Look at the value for EURUSD in the top row. Remarkably, in all timeframes [M5][M15][M30][H1][H4][D1][Total], everything is displayed in red!Moreover, using the value in [Total], it shows a negative -5007.8. Since there is a strong downtrend across all timeframes, the course is to aggressively "sell".
Now, 15minute chart to be checked.
drop or more.
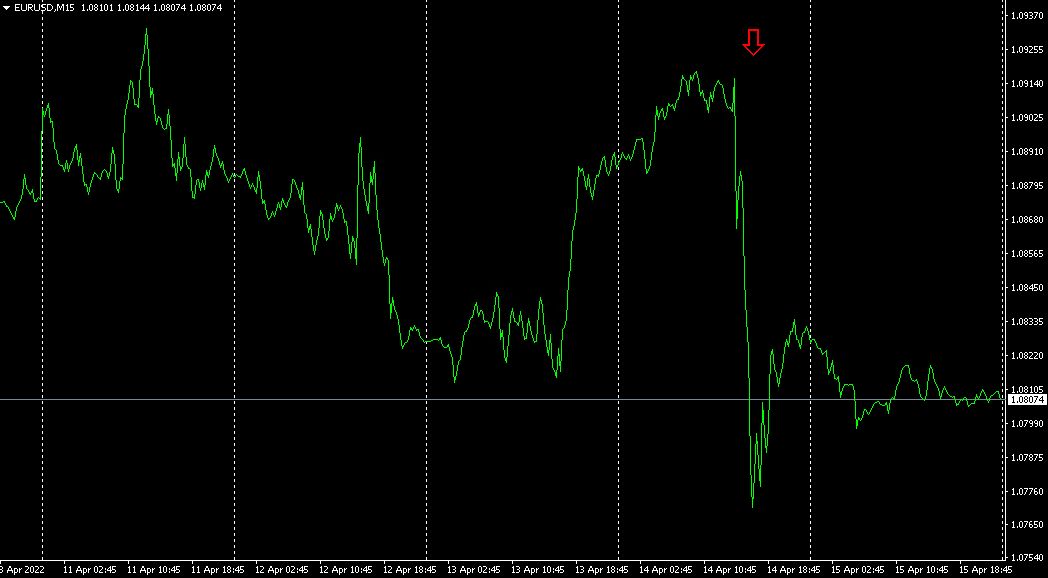
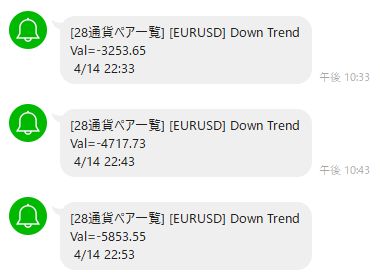
[EURUSD]
The bottom line of the "28CP Best Select" indicator shows USDCHF,which indicates a strong uptrend on all timeframes except [D1]. is a "buy". Then, check USDCHF chart.
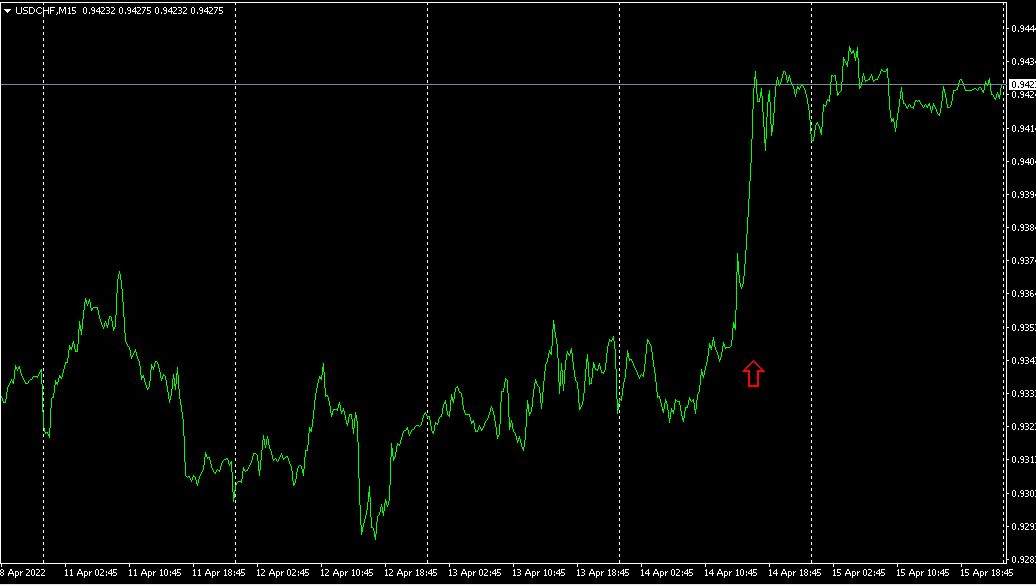
[USDCHF]
Using the "28CP Best Select" indicator, you can instantly determine which currency pair has the strongest uptrend and which has the strongest downtrend among 28 pairs.
3. Since May last year5, what happened to EURJPY?
Since 2021 year5, we have tracked EURJPY.
To see the overall trend, a30minute chart displaying roughly the last3 weeks is drawn.
Last time, I wrote the following.
Indeed, the price is capped at the high. The moving average line(200SMA) has flattened horizontally. Draw a channel line or a horizontal line, approach the upper line, and when it reverses, trade by selling.
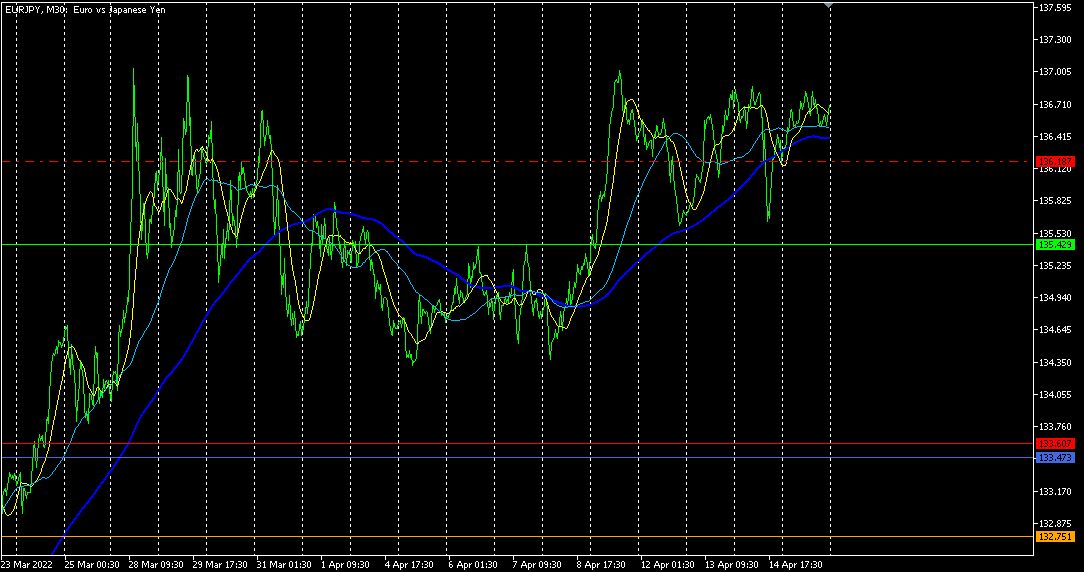
From the latest double top, drawing a horizontal line indicated this level would act as resistance, and it seemed it would reverse, but it quickly broke above. It is moving in a range just above the next zone.
As it has risen this high, the weekly upper line is nearby, so further upside is unlikely. Look bearish, and when it declines, sell.
【My currently listed items】


