Hello! This is Muroi from GogoJungle.
In this video series we introduced “tensoko” as well, probably
|
| ❝ | Where is the entry point with a high probability of winning trades?Finding it is extremely difficult. | | ❞ |
for you who feel the same as ‘you’ do
For many years, he has toiled, struggled, and continued his research.
As a result of that research, the culmination of the technical analysis he developed is
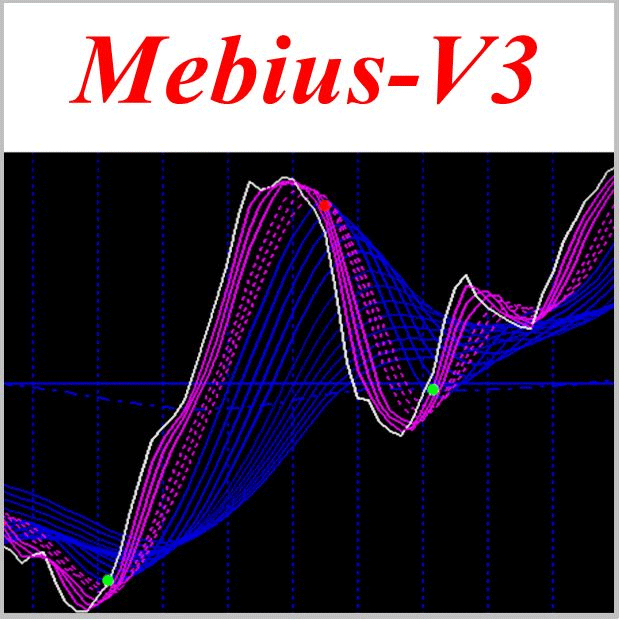
a main chart that combines moving averagesanda
that shows whether the current market is oversold or overbought a sub-chart using the Stochastic Oscillator
to look atto capture turning points and apply them to trading.
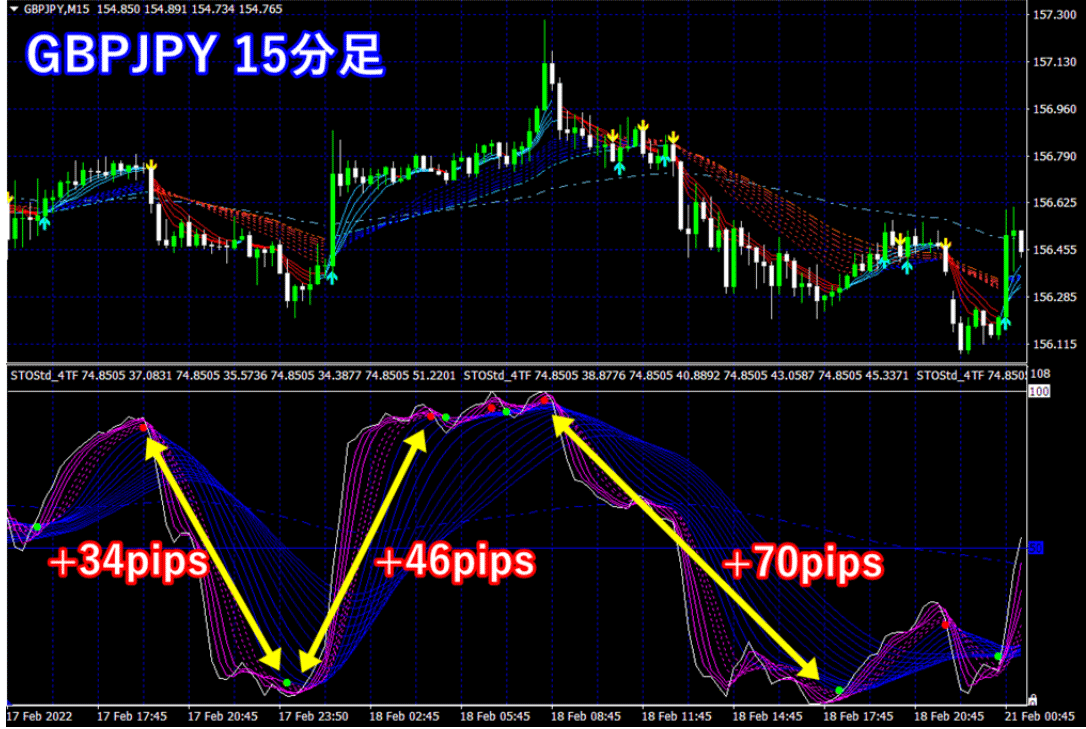
‘Mebius-V3’ main chart (top) and sub-chart (bottom) |
Oscillator-type technical analysis like the Stochastic Oscillator often gets stuck to price and is thought to be unusable, but according to “tensoko,”
that is because
|
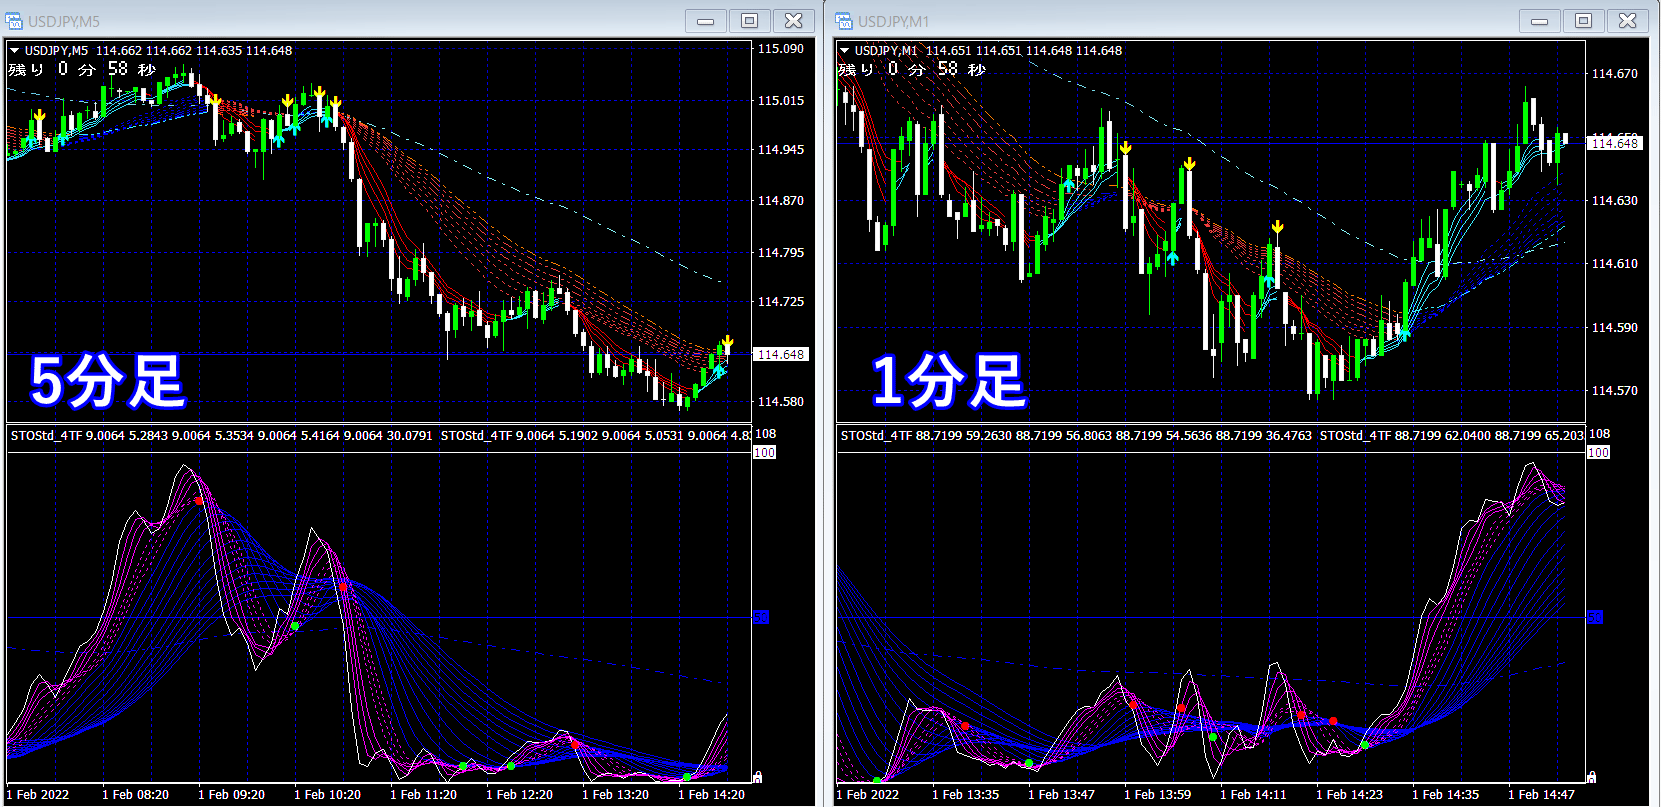
you can incorporate 1-minute, 5-minute, and even longer timeframes—Multi-Time-Frame Analysis into your approach |
and, by doing so, you can fully apply it to trading and make your own trades successful.
The importance of looking at multiple timeframes!
|
As a reminder, the practice of checking higher timeframes—endorsed by successful traders—greatly increases trading accuracy.
By adding Multi-Time-Frame Analysis,
trading accuracy soars.
And this time, Tensoko has released
|
‘Mebius-V3’ with Sign & Mark Display MT4 Indicator for FX, Binary Options, and Nikkei 225 supports all!
It displays on top of the sub-chart’s Stochastic green markings indicating points with a high potential for an upward breakout
and red markings indicating points with a high potential for a downward breakout
and these markings on the chart
are shown. When you look at past MetaTrader 4 charts,three things to review are
|
① the shape of the moving averages on the main chart |
② the shape of the candlesticks on the main chart |
③ the shape of the Stochastic on the sub-chart |
carefully examine these three to understand
when such markings occur and whether they actually lead to a breakout and a trend forming
|
imprinting this in your mind is極めて学習効果が高い for improving trading skills. |
is.
Additionally, it is said that highly successful investors memorize many past chart shapes and, in real markets, adapt those shapes to trade; practicing such trading is exactly what this training offers you.
By practicing this training, you can escape the habit of taking positions too readily and
This is how you will progress.
advance to becoming a trader who survives and achieves great success.
|
|
Before beginners and intermediates grow, your margin could be dramatically reduced and forced exit from the market can be prevented —you can survive and become a highly successful trader
and leap to real success |
This is how you progress.
In this video, please review the aforementioned trading logic and the methodology for trading practice from tensoko, and
‘Mebius-V3’ Sign & Mark Display MT4 Indicator for FX, Binary Options, and Nikkei 225 – all supported! |
If you consider using it for trading practice, your investment results will likely improve. Indeed, your investment results will improve.
|
| -Contents of the Interview- |
|---|
|
|
|
|
|
|
|
|
|
|
|
|
|
| and more! |
|---|
| Episode 4 | | 【Special Video】MTF analysis and memory training of chart shapes dramatically lowers beginner and intermediate market exit rates! “tensoko” | |
▼ Here are past special videos ▼ |
Mebius-V3 that instantly captures tops, bottoms, and turning points at first glance.
By using MTF analysis, you can learn as you trade by following markings that bring you closer to winning traders. You can trade while learning, as you can see.
Please improve your trading skills with “Mebius-V3”!!
|