

4/6 Best FX trading information to support side jobs on the Internet
<4/5 USD/JPY Results>
Tokyo range: 122.38=99, NY range: 122.76=67
Yesterday's commentary was unusually rough/approximate,
“From yesterday's market moves, I revised that not only a breakout to the downside but also a potential upside breakout may occur.
The conclusion would become clear today in Tokyo or Europe.”
As a result, an upside breakout occurred, making my“Dollar/yen aiming for 130 in July”analysis more likely to be correct.
<4/6 Tokyo USD/JPY Outlook>(as of 8:20)
As a technical analyst and professional advisor in the USD/JPY market, I strive to provide precise and practical guidance.
This time, having examined the large dollar appreciation trend that began in March 2015,
last week achieved the first stage of 125 yen, and we are now looking for the next move.
The verification points are,
1) whether a preceding correction back to around 120 yen will occur
2) whether the second stage aiming for 130 yen in July will start as is
I expect thisconclusion to be decided over the next three days.
That discussion has already been explained in this week's weekly report, so compare it with this week's results and the weekly report to be released at the end of the week.
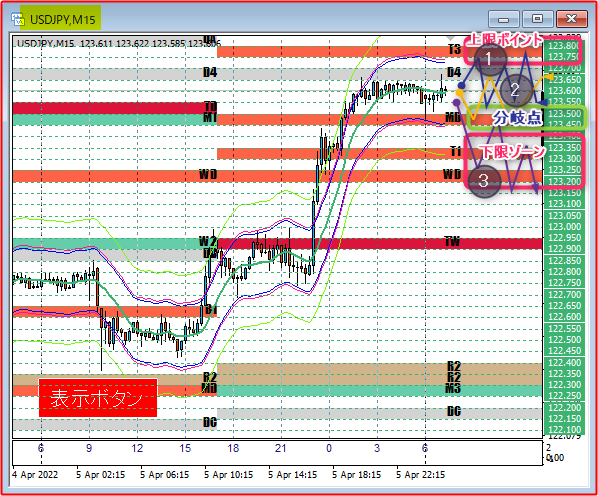
The initial checkpoint is
whether Tokyo can end above the monthly point 123.45-50, the “branch point”
or whether it will dip below the “branch point” 123.45-60 and end in a “lower bound zone” 123.20=35 range, or fall further.
1)The attempt to go higher from the “upper limit” ceiling point 123.75-80 continues but ends still as a barrier
The attempt to go higher from the “upper limit” ceiling point 123.75-80 continues but ends still as a barrier
2)Unable to push decisively, it trades sideways in the 123.50=75 zone between the “branch point” and the “upper limit”
3)If the move does not lead with a clear upside attempt at the “upper limit” 123.45-50, it may instead fail to break and stay around the “branch point” 12.45-50 or end with a slight break lower
3)If the move does not lead with a clear upside attempt at the “upper limit” 123.45-50, it may instead fail to break and stay around the “branch point” 12.45-50 or end with a slight break lower
<4/6 Tokyo USD/JPY Analysis Diagram>
× ![]()


