

Utilization of the "Visualization Indicator" (Part 36)
Utilization of the "Visualization Indicator" (part36)
1. To further evolve the "28 Currency Pair List Indicator" into an indicator
“8CPVisualization Indicator”to drawAUDJPY.
The “8CPVisualization Indicator” includesOceania version,LondonNewYork version,AnyCP version. This time, theOceania version was used.

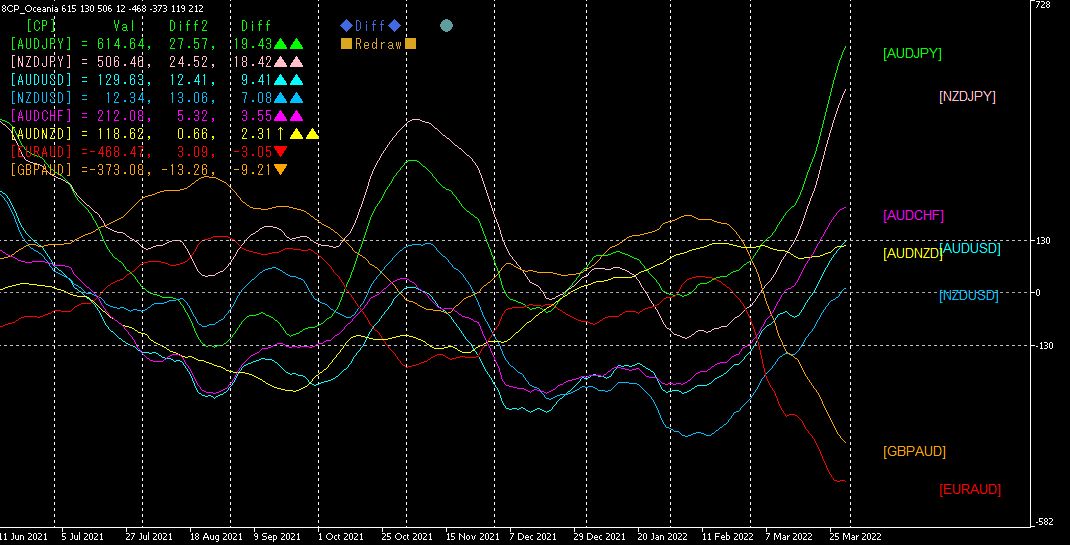
The upper half is theAUDJPY 15-minute chart.
The blue arrows indicate the alert locations of the “28 Currency Pair List Indicator”.
The lower half is the “8CPVisualization Indicator.” The green bold-line graph corresponds toAUDJPY.
There are many alerts from the “28 Currency Pair List Indicator.” The alerts from the “8 CP Visualization Indicator” also appear. The alerts from the “28 Currency Pair List Indicator” appeared on the3/28, but the alerts from the “8 CP Visualization Indicator” appeared well before that. By using the “8 CP Visualization Indicator,” the profit reached about200PIPS.
2. Best Select— try the indicator
3/29,21:42 the screen displayed with theBest Select
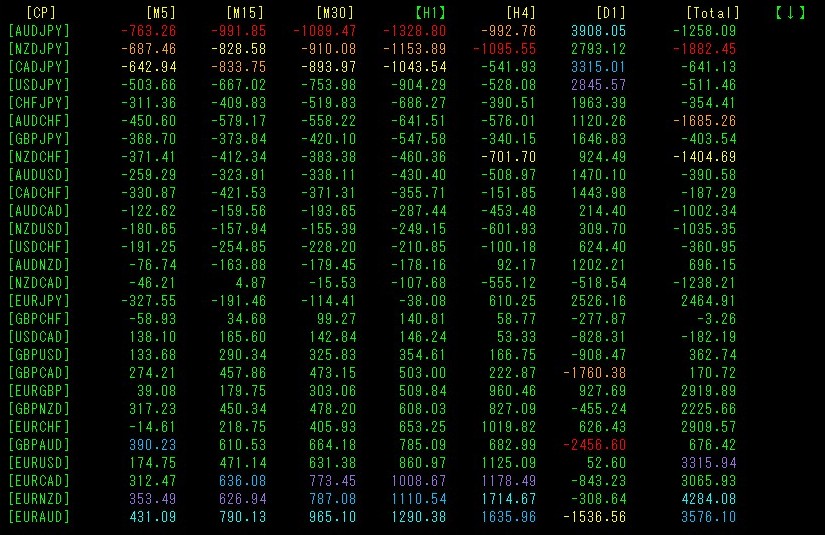
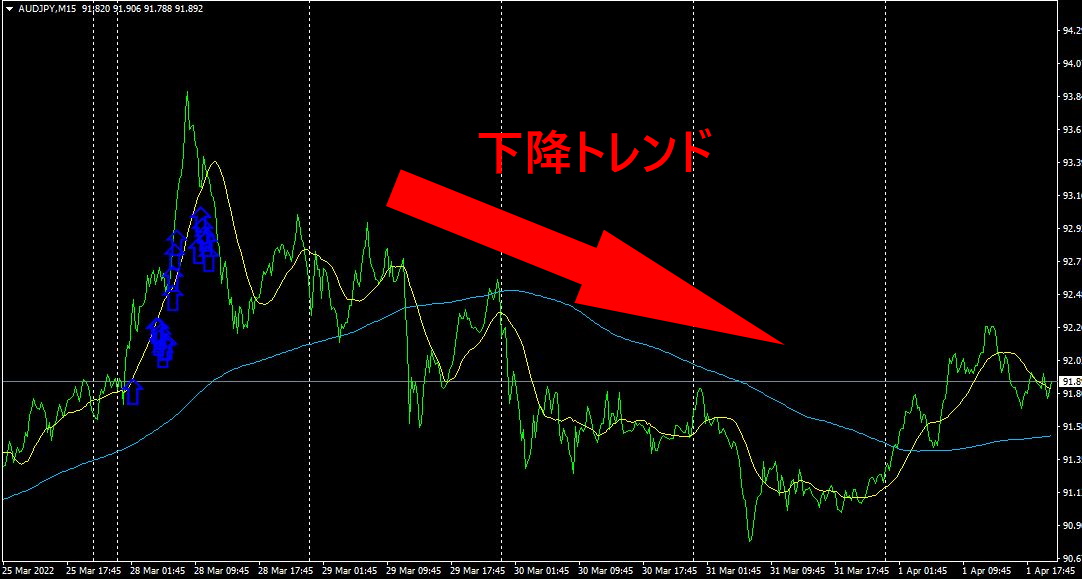
[H1]numbers are sorted in ascending order. The top row’sAUDJPY value is negative in the[M5][M15][M30][H1], and all colors are red. In the short term, a large downtrend is occurring inAUDJPY. However, the daily chart shows positive values, indicating an uptrend on the daily chart. Therefore, entering a sell position is correct for the time being, but holding a short position for the long term is not advisable. In fact, on3/31, the downtrend bottomed and reversed upward.
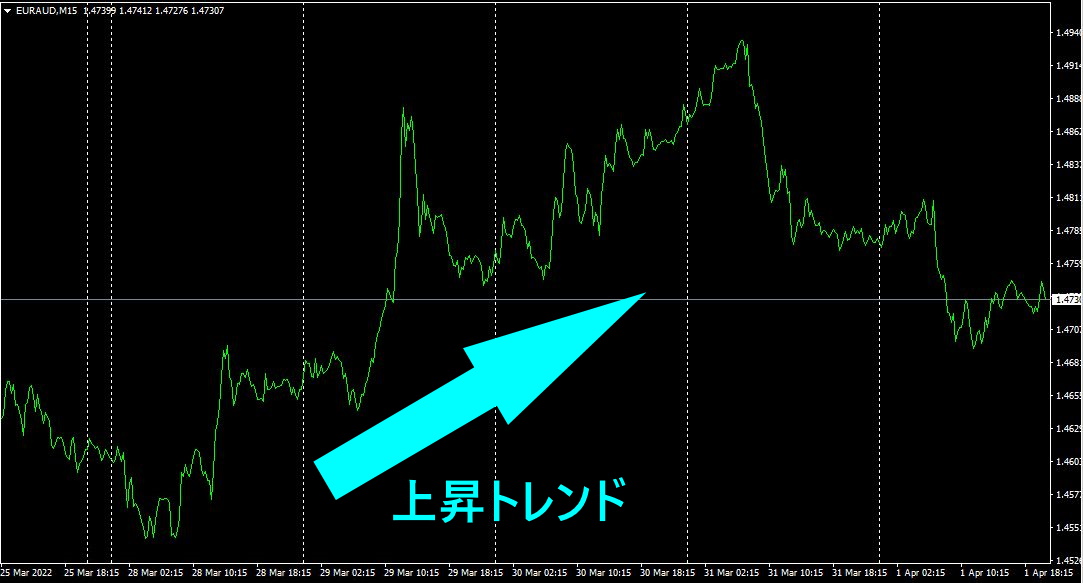
The bottom row showsEURAUD, which is a “buy” as all other timeframes exceptD1 show blue coloring. It seems the AUD currency is relatively weaker. Consequently, is in a downtrend while is in an uptrend.
Next, let’s look at the15-minute
[AUDJPY]
[EURAUD]
If you use the “28CP Best Select indicator,” you can instantly determine which currency pair among the 28 pairs has the strongest uptrend and which has the strongest downtrend. Therefore, the “28CP Best Select indicator becomes an indispensable, powerful tool for investors.
Also, with the recent version update, LINE notification functionality has been added. When the colors for [M5][M15][M30][H1] align, a LINE notification is sent to your smartphone, making trading even easier.
3. Since May of last year, what happened to EURJPY, which I have been tracking?
From May 2021, I have been following the movement of EURJPY.
To see the overall trend, I am drawing about the last three weeks on a 30-minute chart.
Last time, I wrote the following.
It rose in a clean uptrend, nearly straight up. It stayed away from the moving average line (200SMA), and momentum remained strong. It rose more than 1000 PIPS from the bottom, so it is beginning to level off.
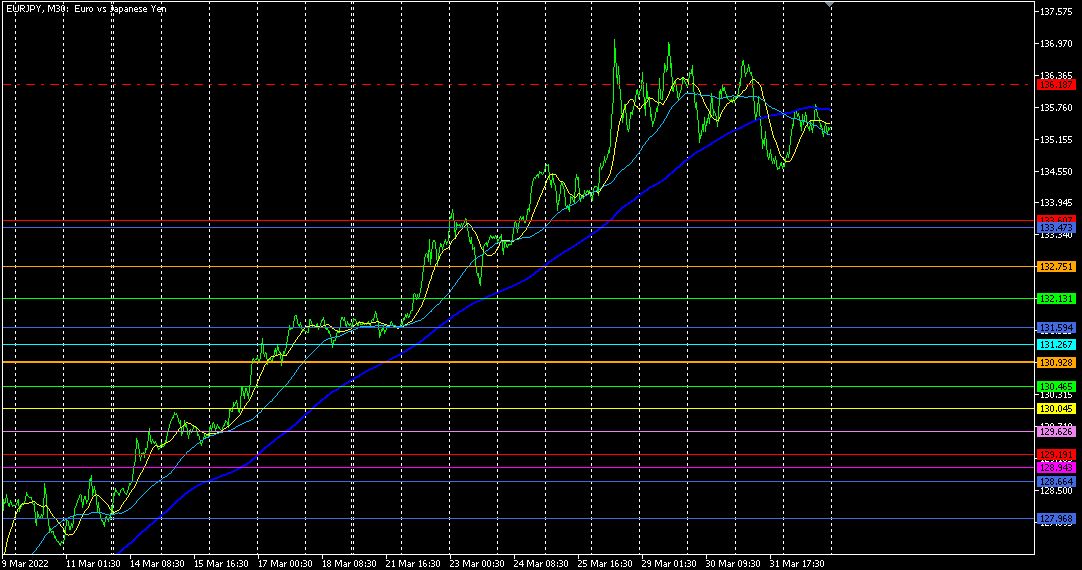
With resistance at the upper levels, and the price being pushed down by the moving average line (200SMA), it seems the market will turn to selling rallies. Let us properly aim for downward moves.
4.Put the “8CPCPVisualization Indicator” on the daily chart,4hour chart,1hour chart, and
Previously, I wrote that the “8CP Visualization Indicator” works better on higher timeframes, but this time I tried daily,4hour,1hour charts with the indicator.
The indicator used was the “8CPVisualization Indicator” Oceania
[Daily]
[4Hour]

[1Hour
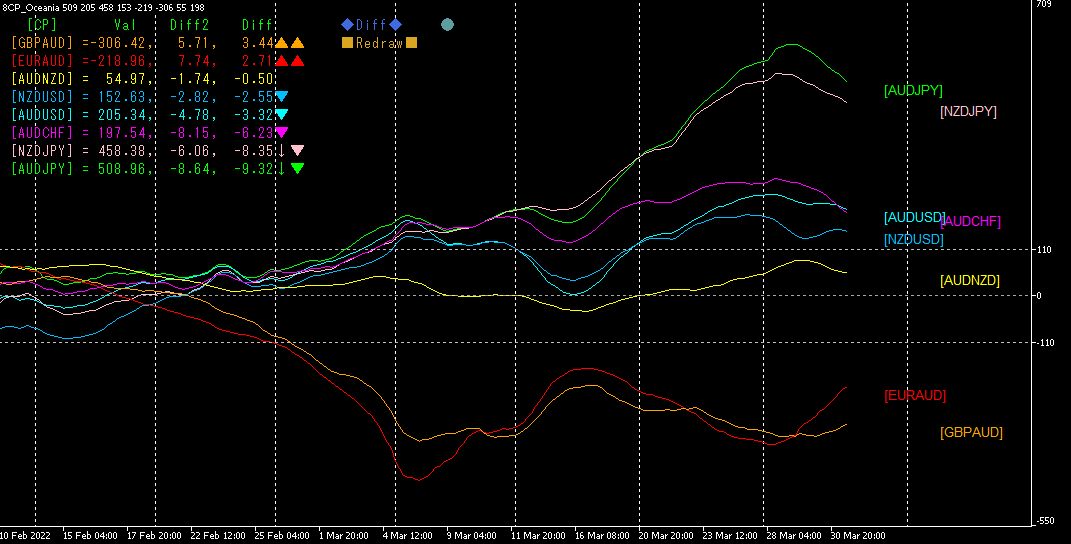
On the daily chart, the uptrends are in AUDJPY and NZDJPY, but the upward momentum is slowing. On the 4-hour chart, both AUDJPY and NZDJPY have hit their peaks. On the 1-hour chart, AUDJPY and NZDJPY are showing a downturn in momentum.1 hour chart indicates that AUDJPY and NZDJPY are contracting downward.
From these, the previous strong uptrend is likely ending, and a downward move is expected. In particular, for the Australasia pairs, the strong uptrend inAUDJPY is likely to be best approached by selling on rallies as a trading strategy.
【My current product for sale】


