

Usage of the "Visualization Indicator" (Part 35)
Utilization of the Visualization Indicator (Part35)
1. Further developing the “28 Currency Pairs List Indicator” into a more advanced indicator
“8CPVisualization Indicator”to drawAUDJPY.
The “8CPVisualization Indicator” includesOceania版London版NewYork版AnyCP版Oceania版を使いました。
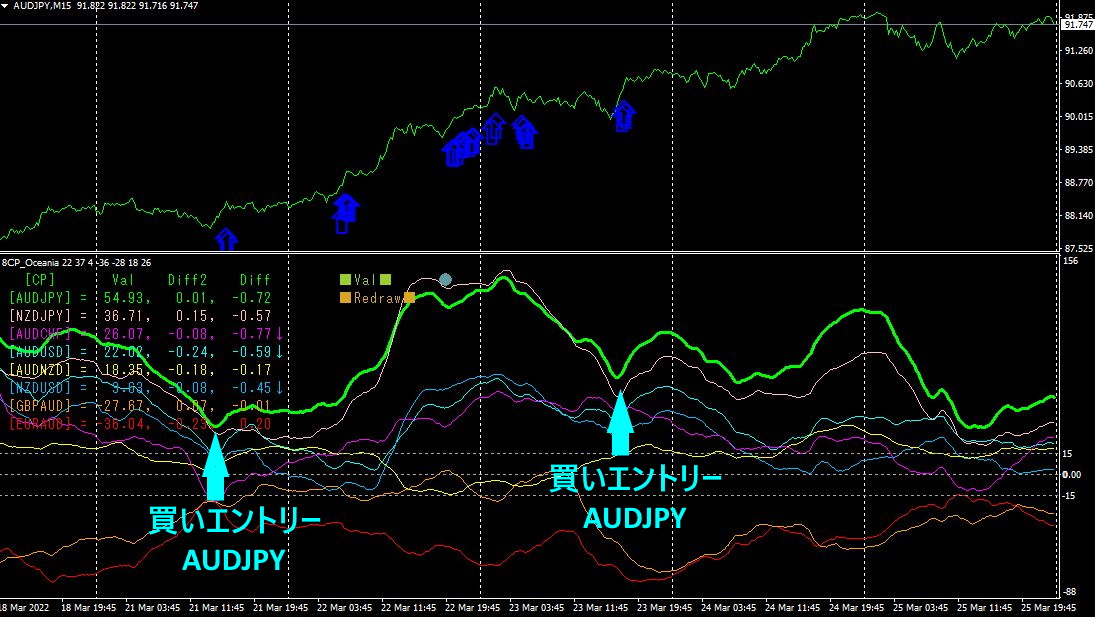
The upper half is theAUDJPY’s15minute chart.
The blue arrows indicate the alert positions of the “28 Currency Pairs List Indicator.”
The lower half is the “8CPVisualization Indicator.” The green thick line graph corresponds toAUDJPY.
There are many alerts from the “28 Currency Pairs List Indicator.” The alerts from the “8CPVisualization Indicator” also appear clearly.AUDJPYis in a typical rising trend, where buying at any point would be profitable.
If you purchased the “28 Currency Pairs List Indicator” and the “8CPVisualization Indicator,” you would have secured profits. If you placed a buy position on Monday’s alert and closed on Friday, you would gainapproximately400PIPSin profit.For example,1lot would yield4,000,000yen in profit,0.1lot would yield400,000yen, so just one trade would recover the cost of the indicators.
2. Best SelectTry the indicator
3Month21day18:53showing on theBest SelectIndicator screen.
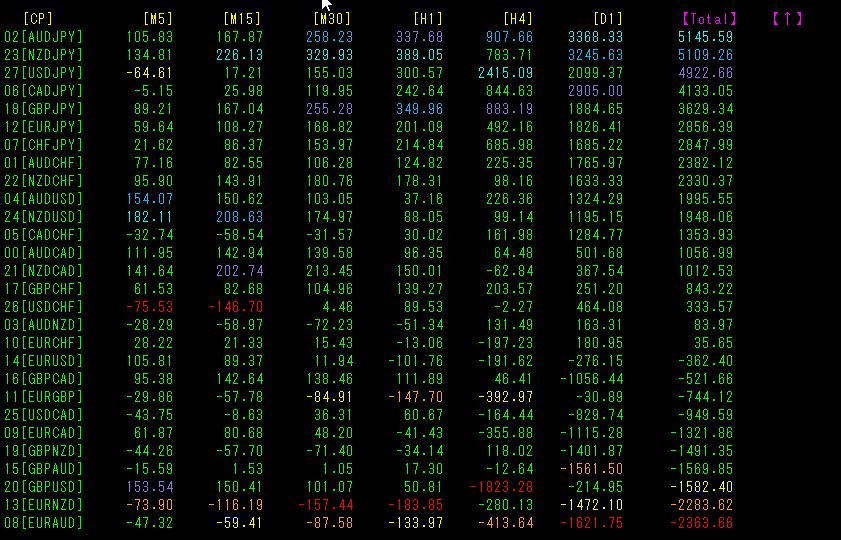
TotalSort by numerical values.AUDJPYhas a positive value of5145and the colors of all timeframes from[M30][H1][H4][D1][Total]are blue-toned. The currency pair with the current strongest uptrend isAUDJPY[M5]to[D1]are positive, with the longest-term timeframe showing the largest value, making it easy to identify at a glance. Therefore, you should consider buyingAUDJPY, and all values from, and because the long-term values are particularly strong, holding a long-term buy position should yield substantial profits.
The AUDJPY chart has been in an upward trend since the week before last.
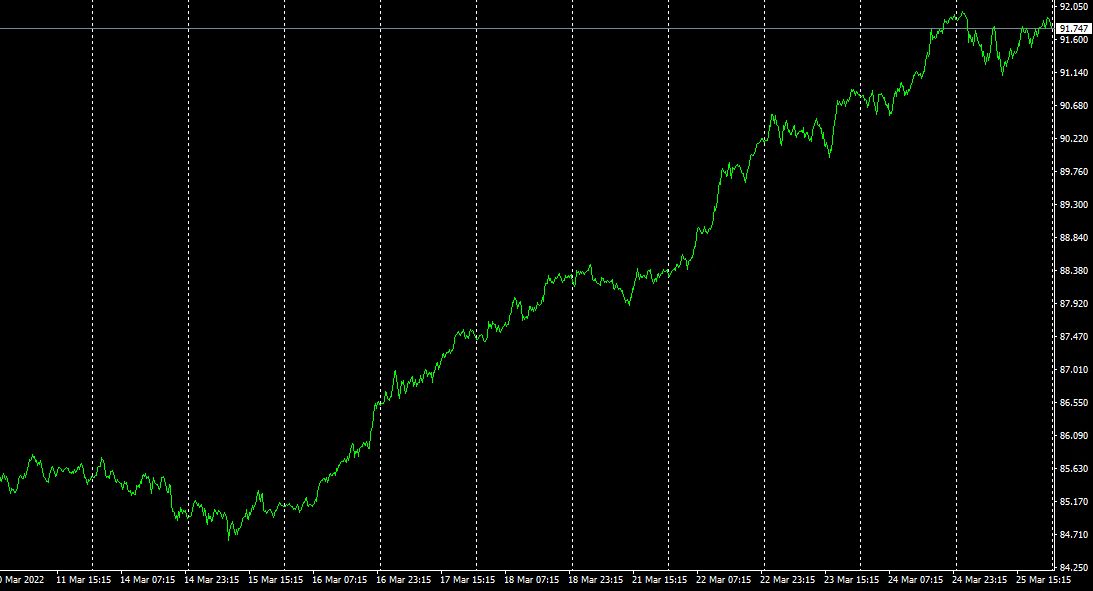
The chart above shows aboutAUDJPY’s2 weeks of data (from3/11 to3/25) on 15-minute intervals.
FromMarch15 day onwards, the uptrend continued.730PIPS. ByMarch, it seems to have come under slight resistance.
Which currency pair should be chosen, whether the entry direction is buy or sell, and what is the best entry point, both long-term and short-term perspectives, the “Best Select” Indicator will guide you.
3. What happened to EURJPY, which has been tracked sinceMay of last year?
We have been tracking EURJPY sinceMay, 2021.The movement of EURJPY has been observed.
To see the overall trend, a 30-minute chart depicting roughly the past3 weeks is drawn.
Previously I wrote the following.
It rose in a clean uptrend, almost linearly. It rose while maintaining distance from the moving average(200SMA), showing strong momentum.
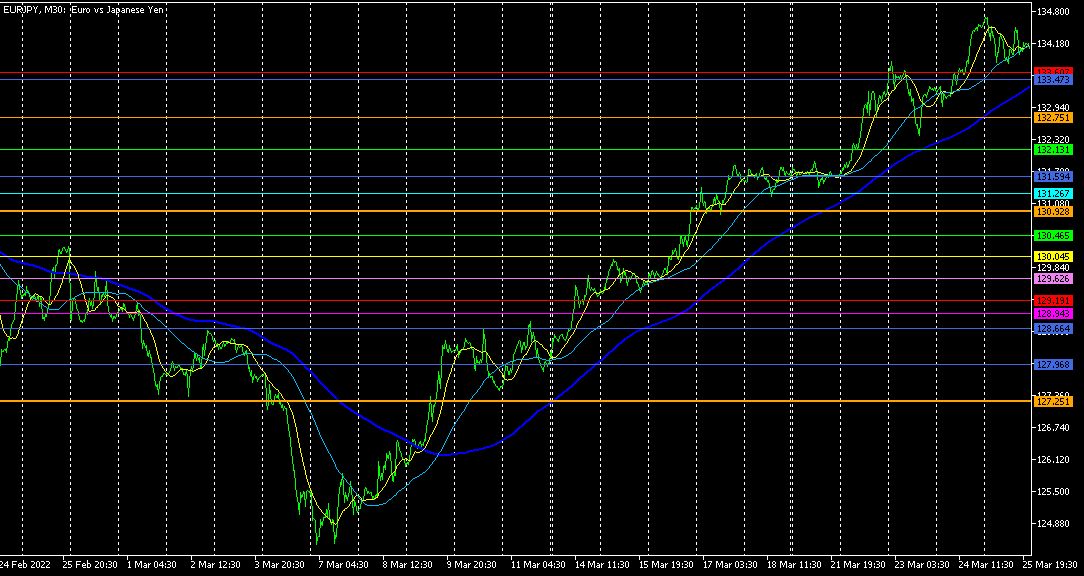
It rose in a clean uptrend, almost linearly. It continued to rise while maintaining distance from the moving average(200SMA), with strong momentum. It had risen over1000PIPS from the bottom, so a top is starting to form.
4.I added the “8CPVisualization Indicator” to a daily chart
Up to now, I used the “8CPVisualization Indicator”on short-term charts such as 5-minute to primarily use for day trading.4Using it on longer timeframes of hourly or higher allows for slower swing trading as well. (It may be better suited for long-term charts.)
The figure below shows the daily chart with the Oceania version of the “8CPVisualization Indicator.”Oceania版.
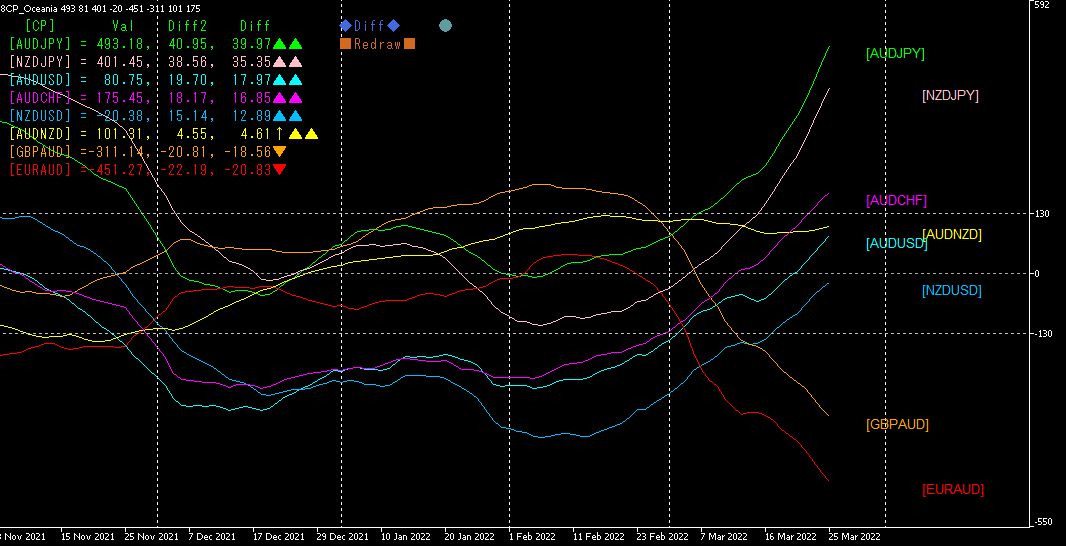
On the daily chart,2021 year11 month to2022 year3 month, about5 months are shown.
The buy-outliers are AUDJPY andNZDJPYGBPAUD.8 charts show where to place positions, assuming settlement onMarch.
Currency pair Position Date Direction Profit(PIPS)
AUDJPY 3Month4day Buy708
EURAUD 3Month7day Sell Stop120PIPS
Re-entry,530PIPS
NZDJPY 3Month14day Buy504
GBPAUD 3Month14day Sell490
EURAUDafter deducting stop losses,currency pairs total exceeded. Rather than stressing with day trading or scalping, the daily chart-based is a better approach for easy profits.
【My products for sale】


