

3/24 The Most Profitable FX Investment Information for Side Jobs Online
< 3/23 USDJPY results >
Tokyo range: 120.79=121.41, NYC range: 120.60=121.16
Tokyo, as expected, hit a “ceiling point” at 121.45-50 and reversed,
forming the basic market pattern of “test the ceiling and reverse.”
forming the basic market pattern of “test the ceiling and reverse.”
In Europe, further downside adjustment continued, supported by the resistance band (4),
and NYC’s “branching zone” 120.90=121.15 remained a backstop at the close.
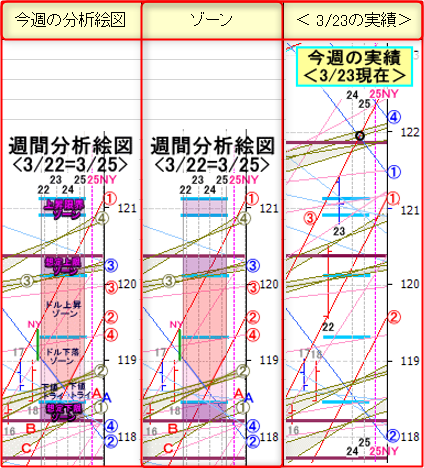
For the first time in a while,I will publicly share daily the “analytical diagram” created in the weekly reportalong with the results.
In the daily horizontal lines , you would only know that price paused, or broke and bounced. To display the horizontal lines as the Support/Resistance on a single day MT4 chart, they become the horizontal lines.
You can see that the important on the pre-analyzed “analytical diagram” pauses correctly.
With this precise information, and it stopping exactly as shown, swing traders or large-volume members can take bold chances and end up easily capturing wide spreads.This is how it works.
< 3/24 Tokyo USDJPY outlook > (as of 8:20)
Today's view of Tokyo is straightforward.
Simply participate in the trend when breaking the branching zone 120.90=121.15.
Of course, expectations are easy participation and larger profit from the gap above.
The ideal take-profit target is a strong resistance zone including two ceiling points, 121.75=122.10, for taking profits and then re-entering with new short positions.
< 3/24 Tokyo USDJPY Analytical Diagram >
× ![]()


