

【Crude Oil/OIL】Swing Trade Outlook (2022/3/22)
This time, we will explain the outlook for the crude oil market (OIL). Since I view it with swing trading in mind, I will take a somewhat longer-term perspective.
I analyze in the video, but if you want to see only the key points in a short time, please read the article below.
① Crude oil market in an uptrend from monthly to daily charts
② Potential range due to the upper shadow and the low on the monthly chart
③ Weekly trendline is effective for buying on dips
④ Daily chart indicates the Grady 2nd point as a buying point
⑤ Dip-buying points on 4-hour and 1-hour charts
Crude oil market in an uptrend from monthly to daily charts
The trend of crude prices is upward. It is a market where, on every time frame, prices are rising, so buying is warranted.
<Monthly Crude Oil>
<Weekly Crude Oil>
Since the trends align, if you enter at moments when the short time frames trend upward, you have a higher chance of winning.
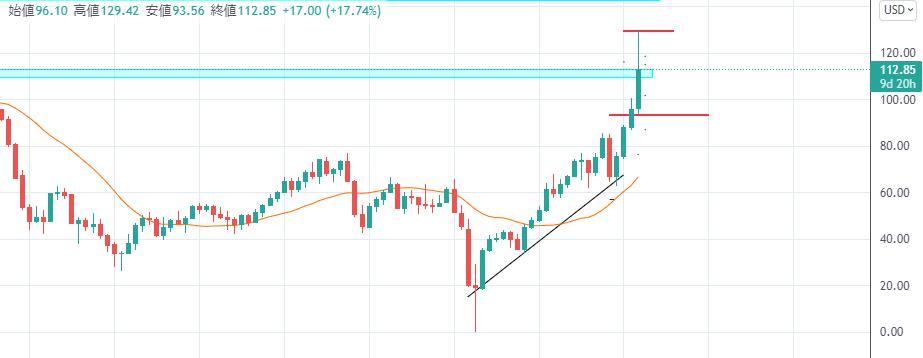
Potential range due to the upper shadow and the low on the monthly chart
The monthly chart has a large upper shadow. In such cases, that level often acts as a pivotal point.

As shown by the red lines above and below, that is the pivot level. Moving forward, it is expected to trade within the range between these red lines.
Conversely, if the price breaks above this upper shadow, there is a possibility of a sharp rise to another level.
By the end of March, observe how much the upper shadow is erased. The more the upper shadow is erased, the more April's upside can be expected.
From a long-term perspective, prioritizing this is important.
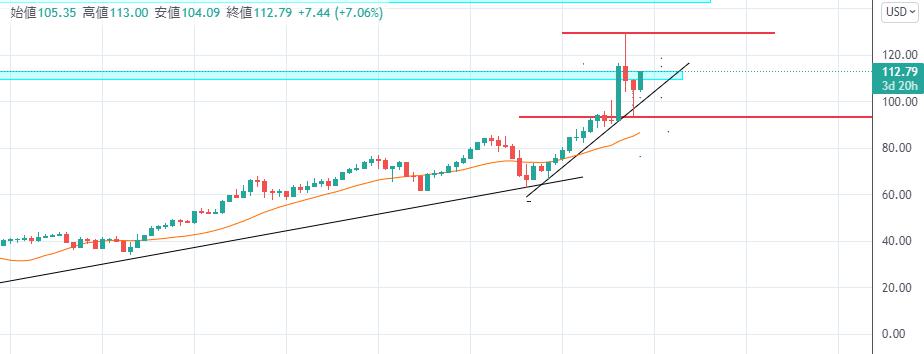
Be mindful of the weekly trendline
The weekly trendline is a line that those who hold crude oil over the medium to long term are watching. If this is broken, there is a possibility of a sharp decline.

Conversely, if this trendline is not broken, many holders will continue to hold. Therefore, it acts as a take-profit line.
For those who do not hold, this is a level where dip-buying opportunities can be targeted upon contact.
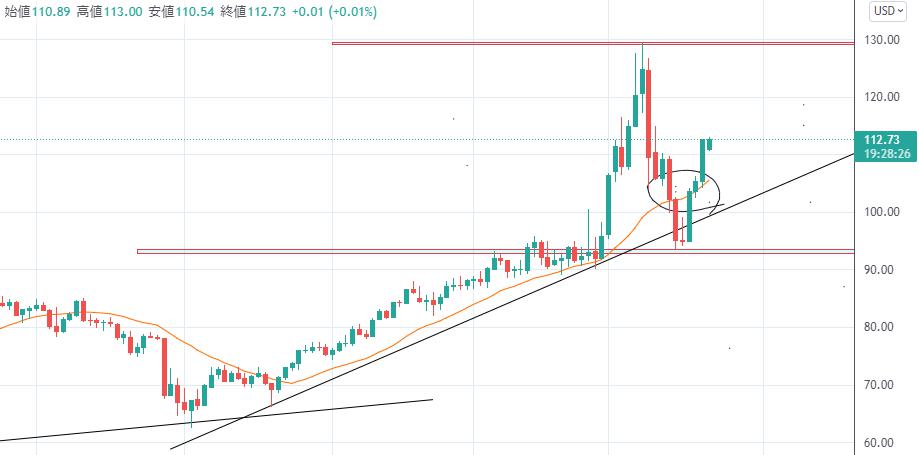
Daily chart: Grady 2nd point was the buying point
On the daily chart for WTI crude oil, the Grady 2nd point represented a dip-buying opportunity, as seen on the chart. It marks the entry point.
4-hour dip-buying point
If you enter on shorter time frames, this is a market where you can win more easily now, so it is recommended to set a target point and enter accordingly.
One method is using trendlines. Wait until you hit this line, and if you see signs of an upside after touching it, you can use it for entry.
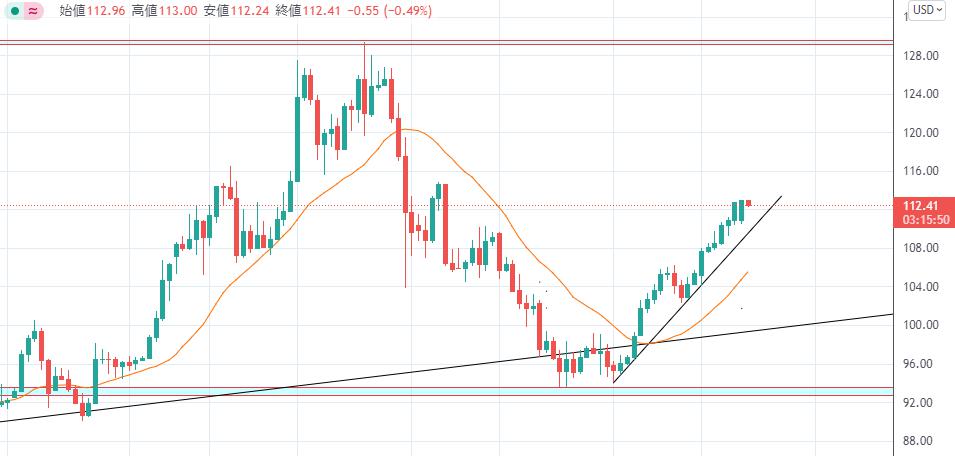
This trendline can be used not only for dip buying but also for taking profits and stop losses. Therefore, like the weekly trendline, it is good to pay attention to the 4-hour trendline as well.
P.S.
I also post analyses of gold, the Nikkei 225, crude oil, Bitcoin, and USD/JPY on YouTube. I also provide explanations of the basic knowledge and chart patterns necessary to keep winning.
If you want to see ongoing market analysis that helps you win, please subscribe to the channel.