3/22 High-winning-rate FX information realized as a side business
<3/22 Tokyo USD/JPY Development>(As of 8:20)
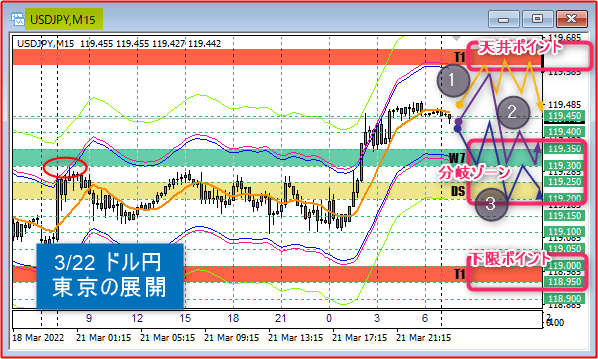
Tokyo has prepared an analysis diagram as a crucial scene whether it will be a wall at the upside attempt of the ceiling point 119.60-65 or break through,
and just now the “ceiling test” has begun.
If it were Tokyo time, it was considered to form an 80% wall, but due to the aggressive move before the Tokyo 9:00 open,the possibility of a breakoutemerges.
Therefore, for investment, it is simple: when it breaks out, participate by buying, and when the wall is confirmed, participate in selling.
(1)When breaking out, participate in buying. Expected range: maximum 119.50=120.45
Take-profit targets are best at the monthly point 120.40-45 and aim for take-profit from the weekly point 120.10-15.
In other words, in Tokyo time, the maximum is the monthly point 120.40-45.
(2)If it becomes a wall, participate in selling. Expected range: maximum 119.20=119.65
The turning point is whether in the decline the “branch zone” 119.20=35 stops the fall,
or it breaks lower and continues to the “lower bound point” 118.95=119.00.
The difference in outcome is that if the “branch zone” 119.20=35 stops the decline,
from the European time, the scene will head again toward the European “ceiling point” 119.90-95.
If, however, there is a downside move to the lower bound point 118.95-119.00, then this week there will be no “ceiling test” from March 23 onward,
and the week will be viewed as a range around the 119 yen level.
<3/22 Tokyo USD/JPY Market Analysis Diagram>