

Is the full-scale adjustment from January?
Hello, I am Nikkei OP Otoko, the administrator.
Thank you very much for visiting this blog.
I would like to provide information that can be of help to everyone, so please continue to support me.
Now, the theme this time isMedium-term trend of the Nikkei 225.
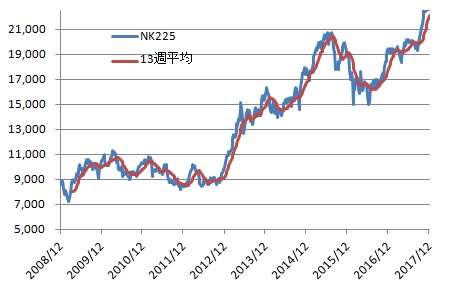
Above is the Nikkei Stock Average (blue) and the 13-week moving average (red).
In other words, it can be seen as the average buying cost over the past 13 weeks.
Therefore, it is suitable for identifying mid-term trend reversal points.
When the current Nikkei average crosses downward under this 13-week moving average, i.e., a dead cross, it indicates a mid-term market reversal.
As of December 22, for the Nikkei average at 22,902.76, the 13-week moving average has just risen above 22,000.
The moving average 13 weeks ago on September 29 was still 19,864 yen, so going forward the 13-week moving average will gradually rise.
If we assume stock prices stay at the same level, the 13-week moving average in about 3 weeks will rise to 22,571.
This area might be a point of trial.
On the other hand, if there is a sharp drop and the Nikkei average falls below 22,000, the atmosphere will change dramatically.
Note) The above is my personal view, and also is intended solely for improving financial literacy. Therefore, it was not created for investment solicitation. Also, while the blog content is based on data from reliable sources, the administrator does not guarantee its accuracy. Final investment decisions are to be made at your own risk.
![]()
Nihon Blog VillagePlease click to support us. Thank you very much. m(_ _)m


Is it OK?