

Use of “Visualization Indicators” (Part 34)
Utilization of "Visualization Indicator" (part34)
1. Further evolve the "28 Currency Pair List Indicator" into an indicator
“8CPVisualization Indicator”to drawAUDJPY.
The “8CPVisualization Indicator” includesOceania version,London version,NewYork version,AnyCP version. This time, theOceania version was used.
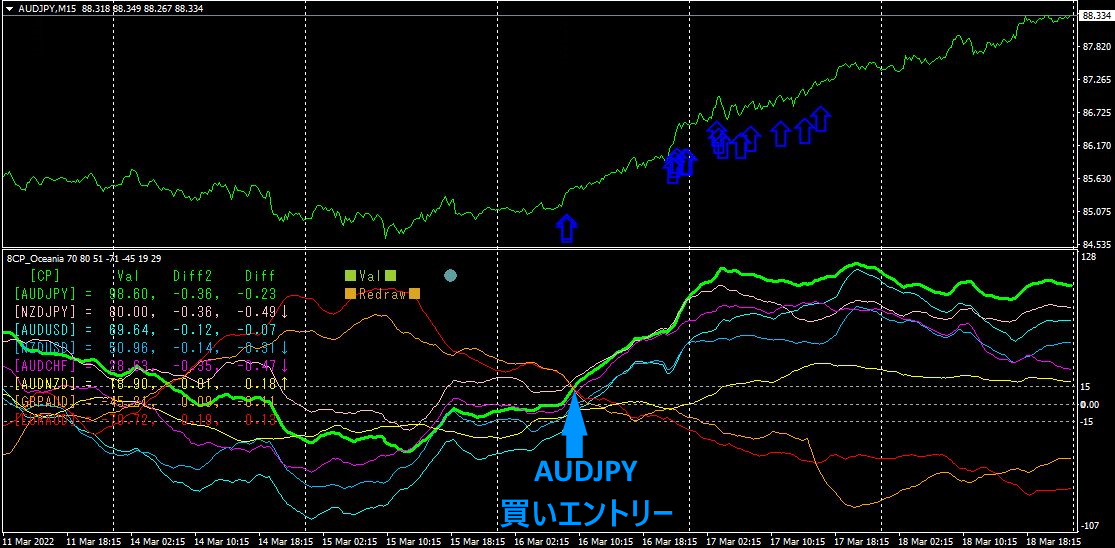
The upper half is theAUDJPY
The blue arrows indicate the alert positions of the “28 Currency Pair List Indicator”.
The lower half is the “8CPVisualization Indicator”. The green thick-line graph corresponds toAUDJPY.
Both the alert positions of the “28 Currency Pair List Indicator” and the alert positions of the “8 CP Visualization Indicator” appear in almost the same place. Because it captures the early stage of an uptrend well, I think both were profitable. If held until the weekend, it would have yielded about290PIPSin profit.
2. Best SelectTry the Indicator
3Month17 day10:14「Best Select Indicator shows this screen.
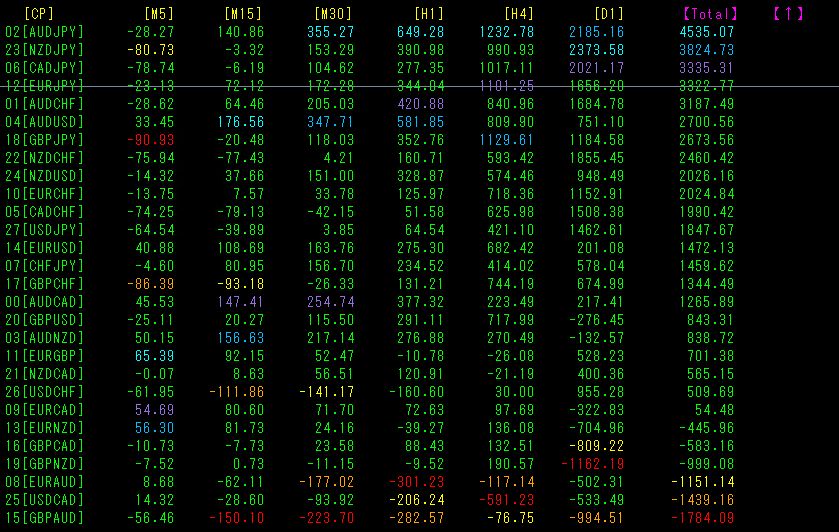
TotalSorted by value.AUDJPY has the largest positive value, and[M30][H1][H4][D1][Total] color all appear in blue hues. Currently, the currency pair with a strong uptrend isAUDJPY, suggesting a short-term pullback may be occurring. Therefore, it makes sense to consider buyingAUDJPY. Moreover, since the long-term figures are large, you can reasonably hold with a somewhat longer-term view.
Now, let's look at the chart forAUDJPY.
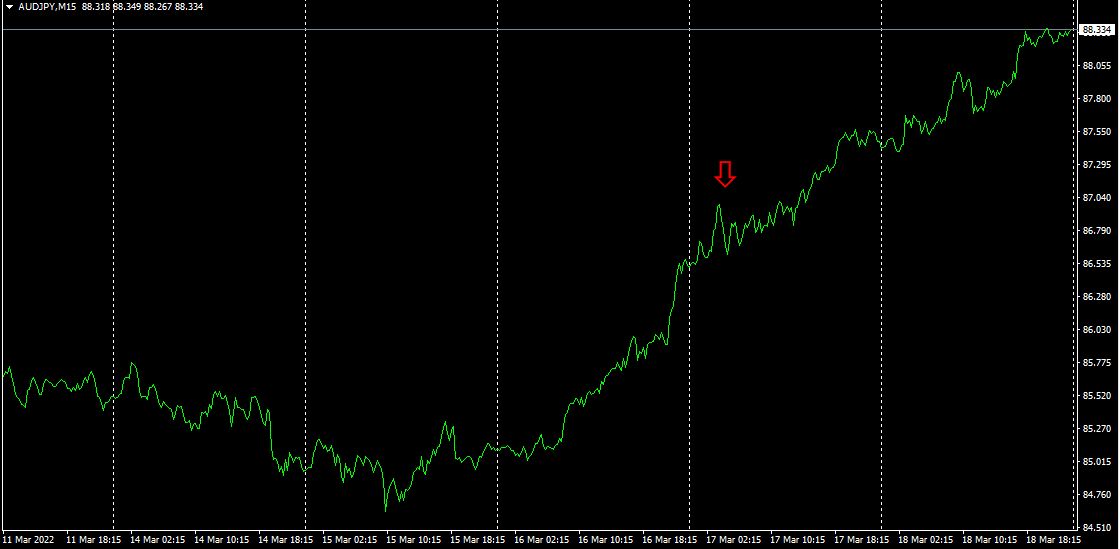
The top diagram shows theAUDJPY on the15-minute chart.
The position of the arrows is the display location of theBest Select Indicator.
It has accurately captured a pullback within the ongoing long-term uptrend.
Which currency pair to choose, the direction of the entry (buy or sell), the best entry point, and long-term as well as short-term perspectives—these are all provided by the “Best Select Indicator.
3. Since May last year, how did EURJPY move?
Since May 2021, I have been tracking the movement of EURJPY.
To view the overall trend, I’ve drawn about the last30 minutes of the past3 weeks on a 30-minute chart.
Last time, I wrote as follows.
Moving average line(200SMA) has also started to turn up. By textbook standards, the story would now focus on buying the pullback, but looking at the daily chart, there are signs it may still move lower..
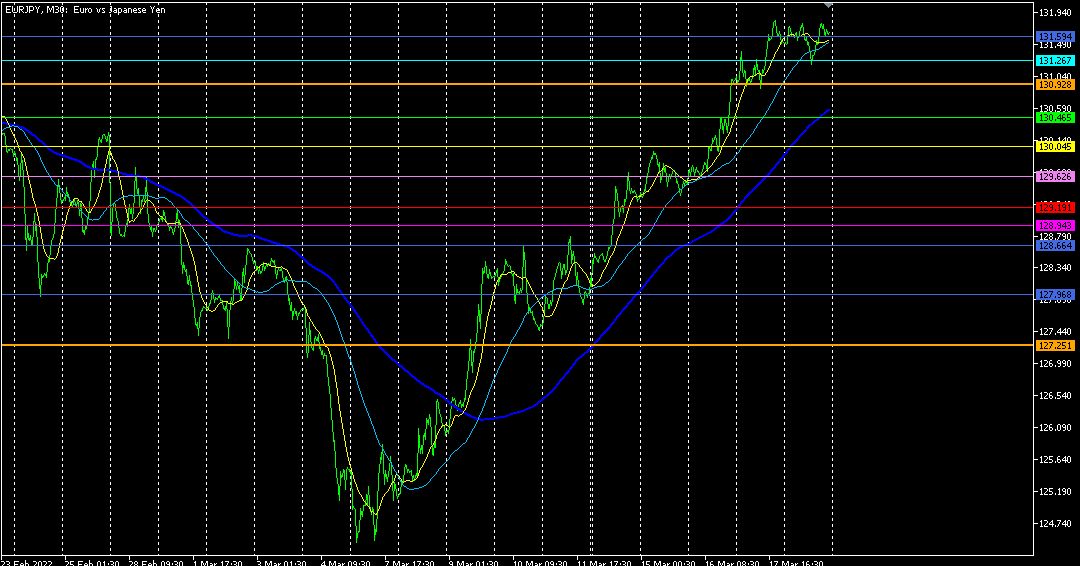
It moved up with a clean uptrend, almost in a straight line. It rose while maintaining distance from the moving average(200SMA), showing strong momentum. However, the price has been repeatedly capped at the 132.83 level. I hope it does not fall sharply after a rapid rise…
【Items I am selling】
https://www.gogojungle.co.jp/users/140198/products


