
【Gold】Swing Trade Outlook (2022/3/17)
This time, we will conduct a technical analysis of GOLD. Gold has risen significantly due to the impact of war, but it is currently taking a breather.
There is an explanatory video, so first please take a look from here.
The key points of the gold market are as follows. We will select them in order, so please watch until the end.
① After the triangle consolidation breaks, it cannot exceed the high, resulting in a large upper shadow
② The daily candlestick pin bar — is it a reversal opportunity?
③ If you are trading on the 1-hour chart, buy on the pullback
After the triangle consolidation breaks, it cannot exceed the high, resulting in a large upper shadow
First, an important aspect of chart analysis for gold is that it has not surpassed its all-time high.
Additionally, it has since formed a large upper shadow. This is a key point because it marks a notable resistance level.
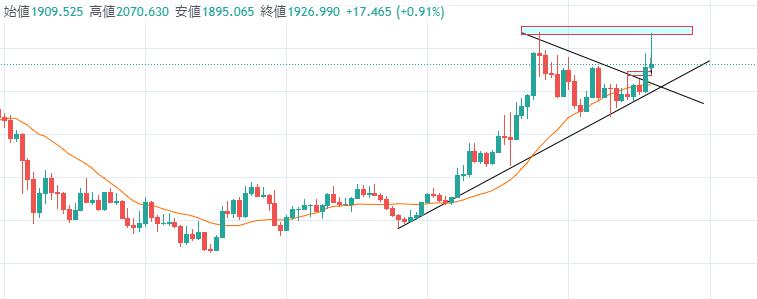
Therefore, how the monthly candle closes is crucial. Currently it is bullish, but if it closes bearish, the downward possibility increases thereafter.
Conversely, if in the latter part of this month the upper shadow is eroded, we may see an update to the all-time high.
Thus, the confirmation of the monthly candle becomes important.
Is the daily pin bar a reversal opportunity?
One of the key points in the gold market’s technical analysis is that the daily bullish pin bar is also a major signal.
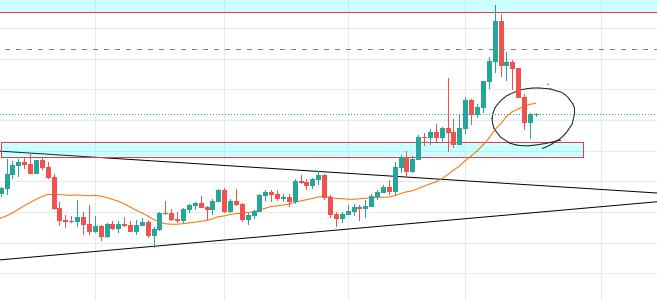
A pin bar is a candlestick that appears at a turning point. Therefore, it indicates whether there is a sign of reversal in gold, which has been declining for the past several days.
Looking at the monthly and weekly charts, although there is a notable upper shadow, the price is still in an uptrend. Therefore, a buying opportunity on pullbacks is arriving.
However, if you are trading on the daily chart, it is safer to wait one more day and enter after breaking the moving average (Graville’s Law No. 2).
If you are trading on the 1-hour chart, buy on the pullback
I already mentioned that a pullback could be a buying opportunity based on the daily bullish pin bar. Looking at the lower time frame, you can determine whether the pin bar actually has an edge.
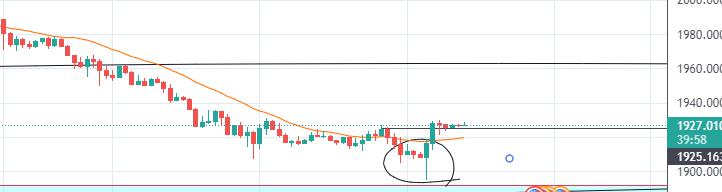
On the 1-hour chart, you can see a large lower shadow and a rise that has surpassed the neckline.
A right-shoulder-upward movement that has crossed the neckline has high edge, making it a buying opportunity unless the pullback becomes too large.
As explained in the video, the MACD is also diverging. The moving averages have broken out, creating an excellent pullback buying opportunity.
Depending on which time frame you trade, but if you mainly trade on the 1-hour chart, I think this is a favorable opportunity.
Of course, no matter how favorable the opportunity is, stop-loss is necessary, so please keep that in mind.
P.S.
I analyze gold, the Nikkei 225, crude oil, Bitcoin, and the USD/JPY on YouTube. I also explain the fundamental knowledge and chart patterns needed to keep winning.
If you want to see more market analyses that keep winning, please subscribe to the channel.