
【Dollar/Yen】Swing Trade Outlook (2022/3/16)
We are explaining today’s FX (USD/JPY) market outlook. First, please watch this video.
In this video, we start from a rather long-term perspective. The key points are as follows.
① Monthly chart forms a reverse head and shoulders (inverse head and shoulders)
② If you break through the level of 125.86 yen, a big move awaits
③ The trendlines on the monthly and weekly charts are a lifeline
④ Be careful not to buy at a high price
⑤ Short-term trading points
Monthly chart forms a reverse head and shoulders (inverse head and shoulders)
The monthly chart looks like it could form a reverse head and shoulders when viewed long-term. The current situation is the third wave of the Elliott Wave.
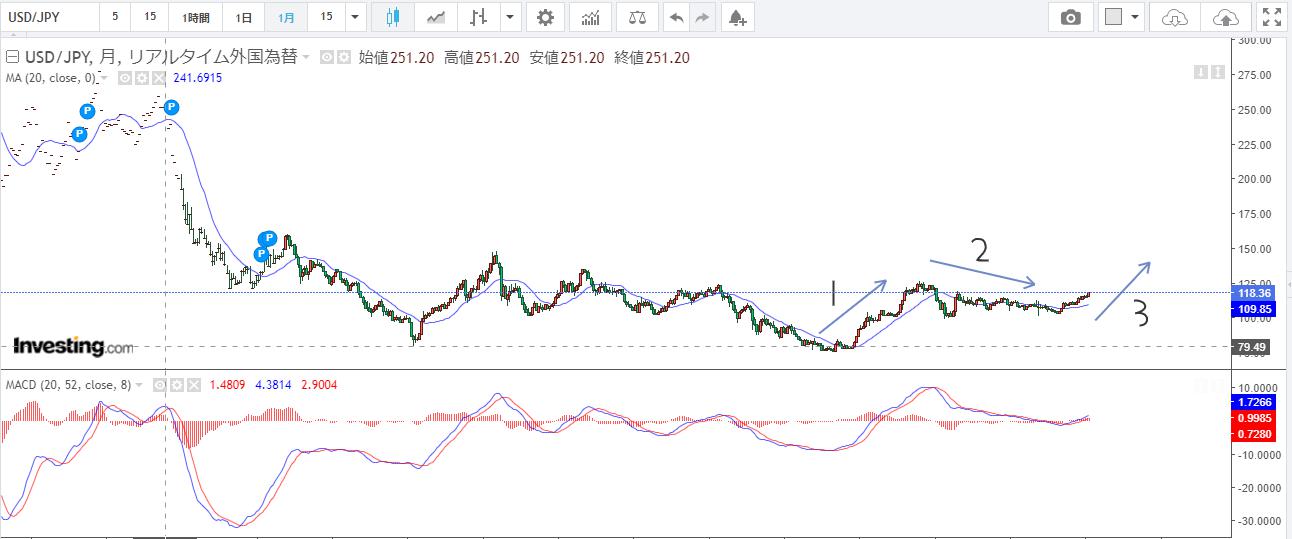
Since it is the third wave on the monthly chart, there is a possibility of a big breakout after forming the reverse head and shoulders.
If you break through the level of 125.86 yen, a big move awaits
The key level is the recent high of 125.86 yen. Breaking above this level would break the neck line of the inverse head and shoulders.
Furthermore, according to Dow Theory, it would form a higher high and shift into an uptrend (currently on a monthly level it is a consolidation).
If that happens, it would become an upward move on the monthly level, potentially shaping a large gain over years, allowing a long-held position.
Therefore, whether this level of 125.86 yen is broken through is a very important point.
Trendlines on the monthly and weekly charts are a lifeline
The weekly and daily charts are in an uptrend, and the USD/JPY market is waiting for an uptrend continuation on the monthly level, but there are points to watch.
If you break the monthly or weekly trendline, there is a possibility of a large decline temporarily.

Conversely, as long as you do not break these trendlines, it can be a buyable market. Those who already hold positions can take profits at the take-profit line.
If you think prices will rise further from now on and buy, this is also a potential stop-loss level.
Be careful not to buy at a high price
Right now, the USD/JPY market is exhibiting a large trend, making it an easy market to win in. If you can buy, you don’t need much analysis.
However, when buying and entering on a break of a high, the risk is that the stop-loss distance becomes large, risking a high-price purchase.
You need to keep lots smaller and enter gradually. If possible, waiting for a pullback before entering is preferable.
Short-term trading points
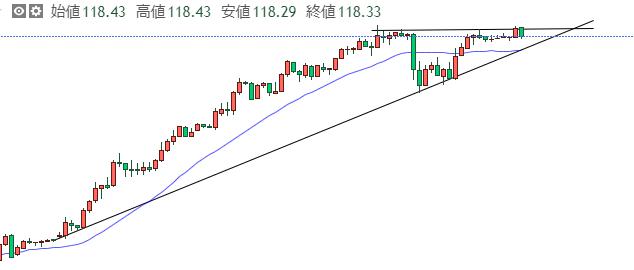
This is a chart zoomed in to the 1-hour timeframe. It is a triangle consolidation within an uptrend, so a breakout to the upside is likely.
If you are entering for a short-term trade, the strategy to aim for is to target the breakout of this consolidation. The trend is up, so enter on a buy when it breaks out. (Using a stop order is good)
Conversely, place the stop-loss on the lower side of the triangle consolidation or at the most recent low. Also, adjust the lot size.
By doing so, you can enter while keeping losses limited.
P.S.
I post analyses of USD/JPY as well as Nikkei 225, crude oil, Bitcoin, and gold on YouTube. I also explain the essential knowledge and chart patterns necessary to keep winning.
If you want to see analyses that keep you winning, please subscribe to the channel.
Investing Emperor Channel Subscription