

Translate the following HTML to English, keep the HTML format, do not include code blocks or line breaks, and decode entities before translating: 3/14東京の展開と2ヶ月間の予測 Translation: 3/14 Expansion in Tokyo and two-month forecast
<Results for 3/11 USD/JPY>
Tokyo range on 3/11: 116.15=80, New York range on 3/11: 116.85=117.35
The forecast for 3/11 was that Tokyo has a 70% chance of breaking above the “ceiling point zone” 116.15=30.
However, even if it broke higher, Tokyo stopped at the “116.50=85 zone.”
The development in Tokyo was a perfect hit..
In New York, as a fortunate miscalculation for investors, it broke above 116.50=85 and continued to the 117 range.
However, even if it broke higher, Tokyo stopped at the “116.50=85 zone.”
The development in Tokyo was a perfect hit..
In New York, as a fortunate miscalculation for investors, it broke above 116.50=85 and continued to the 117 range.
<Next Target 112 Yen>
With this, the large dollar-selling market that began in 2015 from last March has ended, and the big dollar-up market has shifted dramatically.
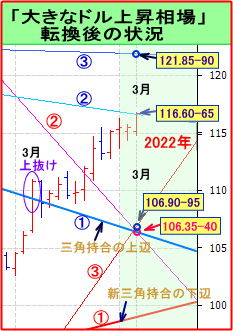
Each week, in the weekly report, I followed with the chart below, but the standard for rising to the high 122 yen area last week exceeded the “monthly point” 116.60-65.
In other words,the market is now fixed to aim for 122.00 for the next two months or so.
Each week, in the weekly report, I followed with the chart below, but the standard for rising to the high 122 yen area last week exceeded the “monthly point” 116.60-65.
In other words,the market is now fixed to aim for 122.00 for the next two months or so.
<3/14 Tokyo USD/JPY Development>(as of 8:20)
Tokyo’s key point is whether it can break above the “divergence zone” 117.05=60, or if it cannot, whether it ends in a consolidate phase in the “divergence zone.”
(1)If it breaks above the “divergence zone” 117.05=60, up to a maximum of 118.00, with 70% approaching the nearby monthly point 117.70-75 for a small rise; it is important that the rising trend is confirmed to continue.
(2)If there is minor movement at the “divergence zone” 117.05=60 and, for this week itself, it will not follow the previous week’s trend toward 119 yen.
Thiswhen the “divergence zone” 117.05=60 is broken for the day,this week's upper limitis up to the maximum “expected upper zone” 118.20=60.
<3/14 Tokyo USD/JPY Analysis Chart>
× ![]()


