

Utilization of “Visualization Indicators” (Part 33)
Utilization of the “Visualization Indicator” (that33)
1. Advance and develop the “28 Currency Pair List Indicator” into a visualization indicator
“8CPVisualization Indicator”to drawEURNZD.
The “8CPVisualization Indicator” includesOceania版,London版,NewYork版,AnyCP版. This time, to renderEURNZD, we used theAnyCp version.
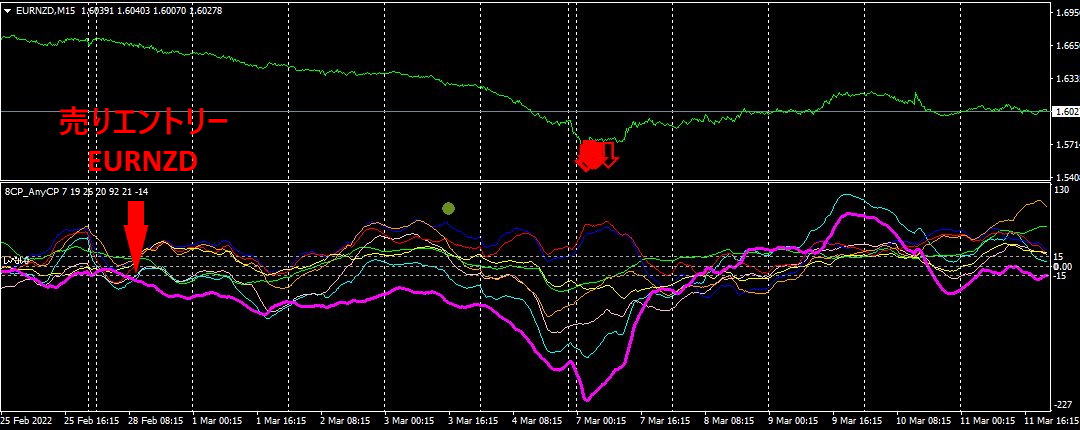
The upper half is theEURNZD 15-minute chart.
The red arrow indicates the alert position of the “28 Currency Pair List Indicator”.
The lower half is the “8CPVisualization Indicator.” The red-violet graph corresponds toEURNZD.
The alert position of the “28 Currency Pair List Indicator” was the end of a trend. If you were using the “8 CP Visualization Indicator,” you could have opened a sell entry position starting from last month’s28th day.
2. Best SelectTry the Indicator
3Month7Day08:51, shown on theBest Select indicator screen.
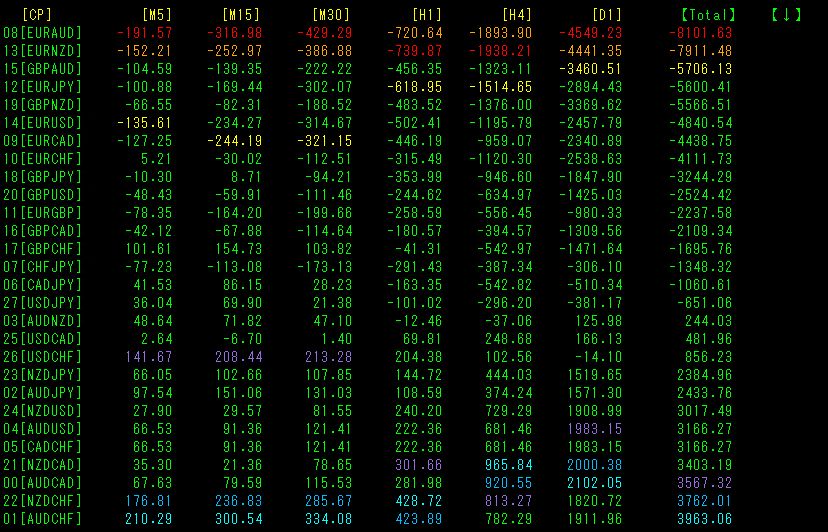
Totalsorted by value.EURAUD[M5][M15][M30][D1][Total] colors are all red. Currently a downtrend is forming inEURAUD, so selecting it and trading short would be appropriate, as judged instantly.
Now, let's look at the chart ofEURAUD.
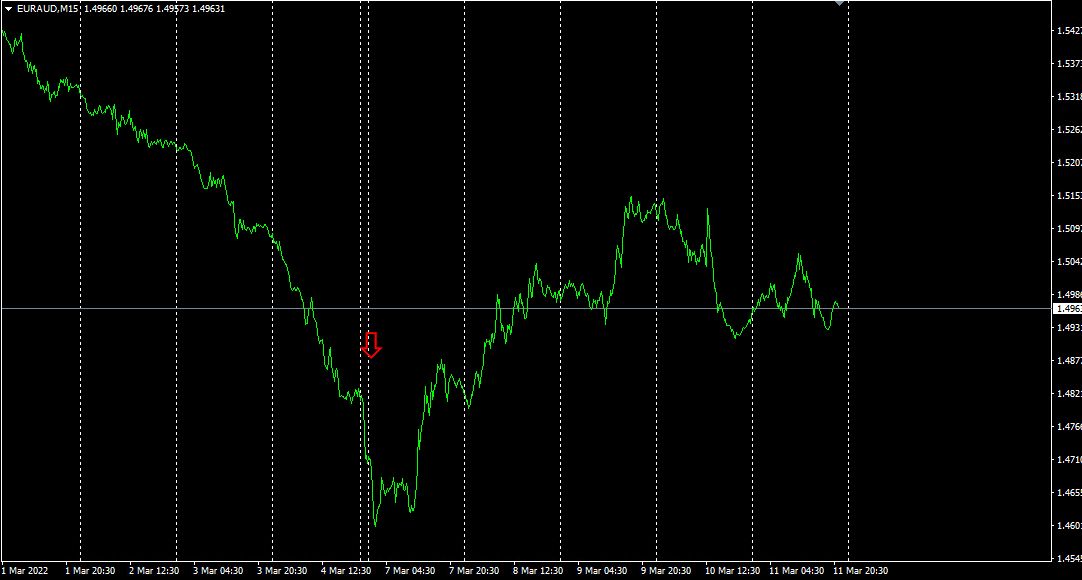
The upper diagram is theEURAUD 15-minute chart.
The arrow position indicates the display position of theBest Select indicator.
It accurately captures the last sharp drop of the downtrend.
Which currency pair to choose, whether the entry direction is to sell or buy, and where the best entry point is, are all indicated by the “Best Select indicator.
3. What happened since last year’s5月?
From May 2021, movement has been tracked.
To view the overall trend, we have drawn roughly three weeks of the most recent 30-minute charts.
Last time, I wrote the following.
It did go down after all. The drawn support/resistance line was easily broken. A reverse head-and-shoulders formed and it dropped sharply, so going forward there may be a period of consolidation.
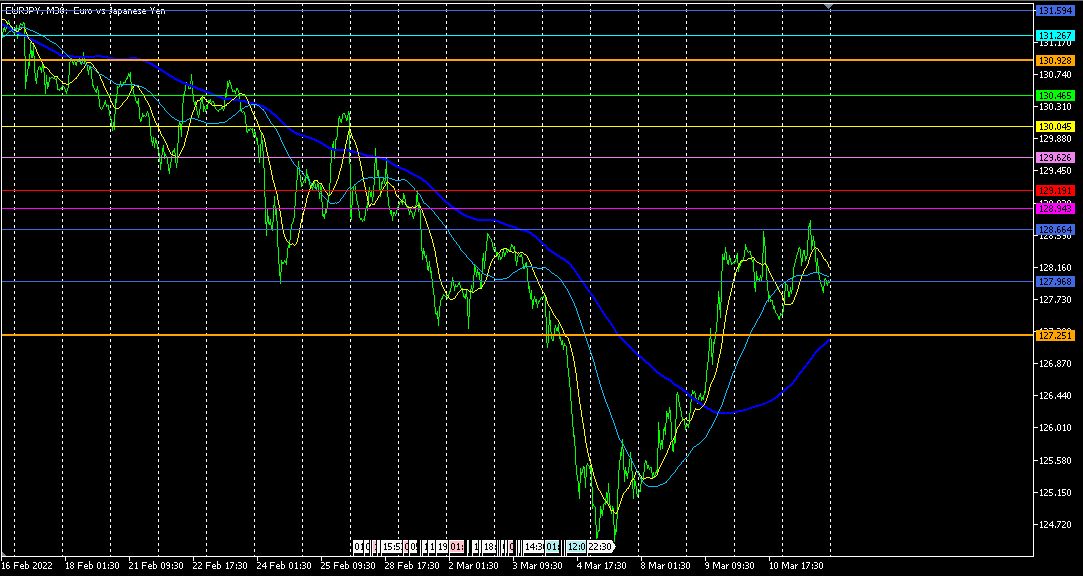
Not just consolidation, it rose significantly. It recovered the losses from the week before. The moving average line (200SMA) has also started to turn upward. According to textbook analysis, the future scenario would be to look for buy opportunities on pullbacks, but looking at the daily chart, there are also signs it may continue to fall.
【My listed products】


