

Use of "Visualization Indicator" (Part 31)
Utilization of the "Visualization Indicator" (part31)
1. Further evolve the "28 Currency Pairs List Indicator" into an enhanced indicator
“8CPVisualization Indicator”to plotEURJPY.
The “8CPVisualization Indicator” includesOceania版,London版,NewYork版,AnyCP版. This time, theLondon版 was used.
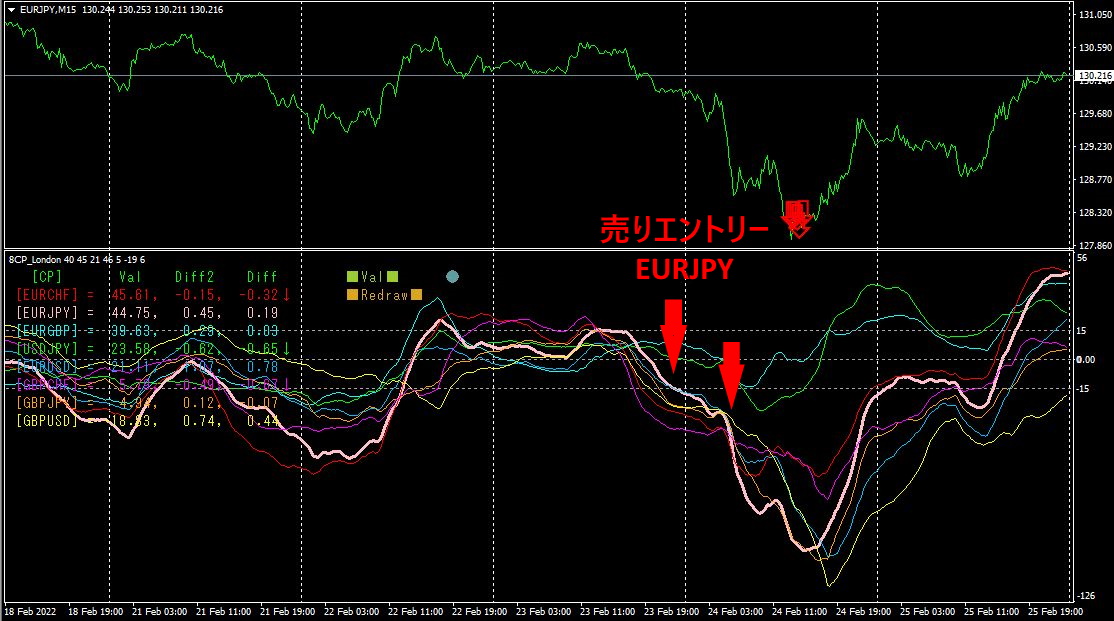
The upper half is theEURJPY 15-minute chart.
The red arrows indicate the alert positions of the “28 Currency Pairs List Indicator.”
The lower half is the “8CPVisualization Indicator.” The pink bold-line graph corresponds toEURJPY.
The selling entry point of the “8CPVisualization Indicator” appeared on2月23日, which would have yielded about190PIPS of profit if sold from there. The alert location in the “28 Currency Pairs List Indicator” was too late.
2. Try the Best SelectIndicator
On February21,19:08, the screen shown with theBest Select Indicator.
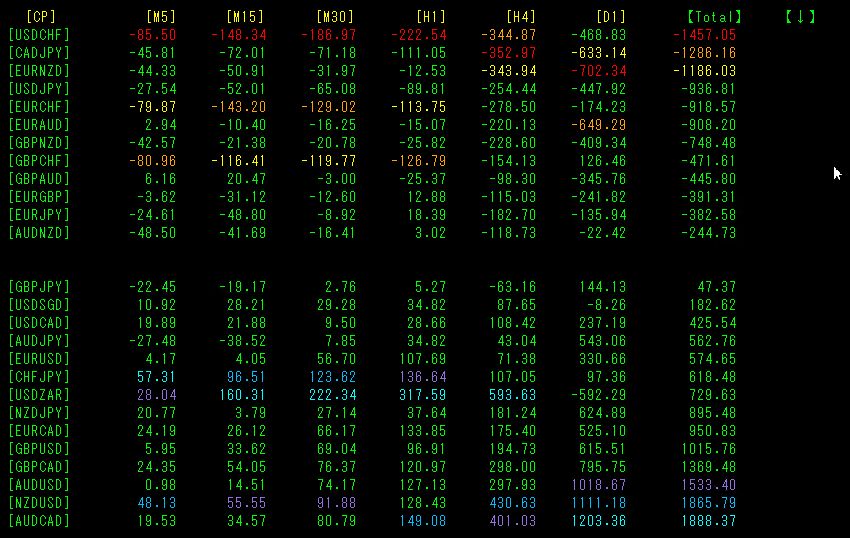
Totalsorted by value.USDCHFhas large negative values,[M5][M15][M30][H1]USDCHF colors all red. With a downtrend currently occurring in
Now, let's look at the USDCHF chart.
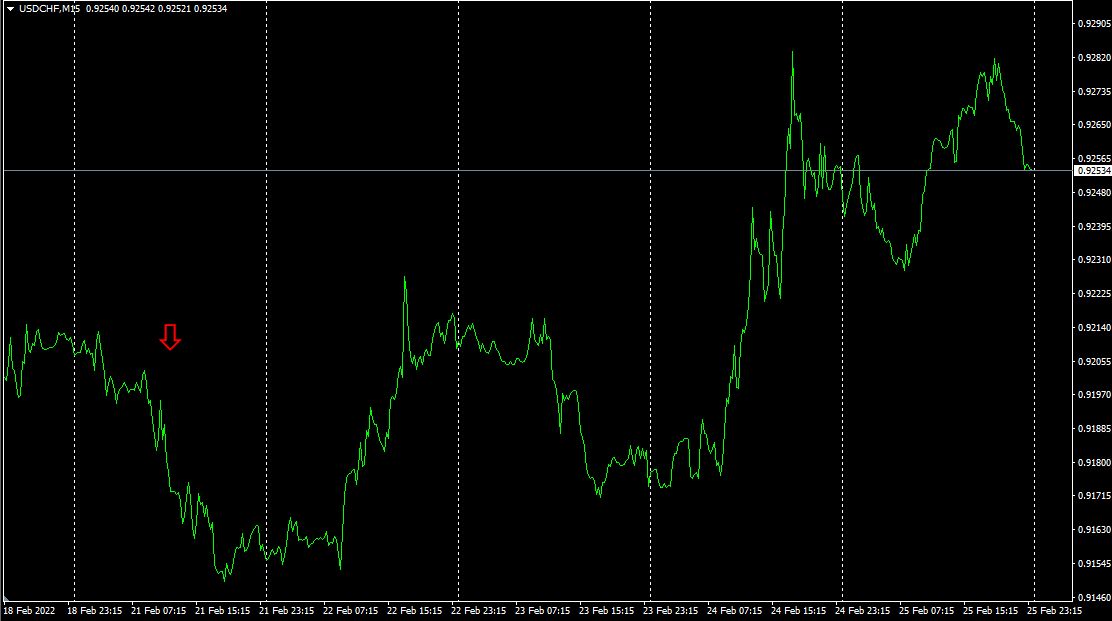
The above figure is theUSDCHF 15-minute chart.
The arrow positions indicate the display location of theBest Select Indicator.
According to theBest Select Indicator,[H4]is orange,[D1]is green, indicating that the long-term downtrend is not very strong. Also-1457, not a large figure, so an early exit is necessary. If about30PIPS of profit is reached, close the trade.
3. What happened to EURJPY, which I have been tracking since May last year?
Since May,2021,EURJPY has been monitored.
To see the overall trend, a roughly 3 weeks’ worth of the last30 minutes chart is drawn, covering about3 weeks.
Last time, I wrote as follows.
SMA200appears to be holding it down. A downtrend with a rebound would be a selling opportunity.
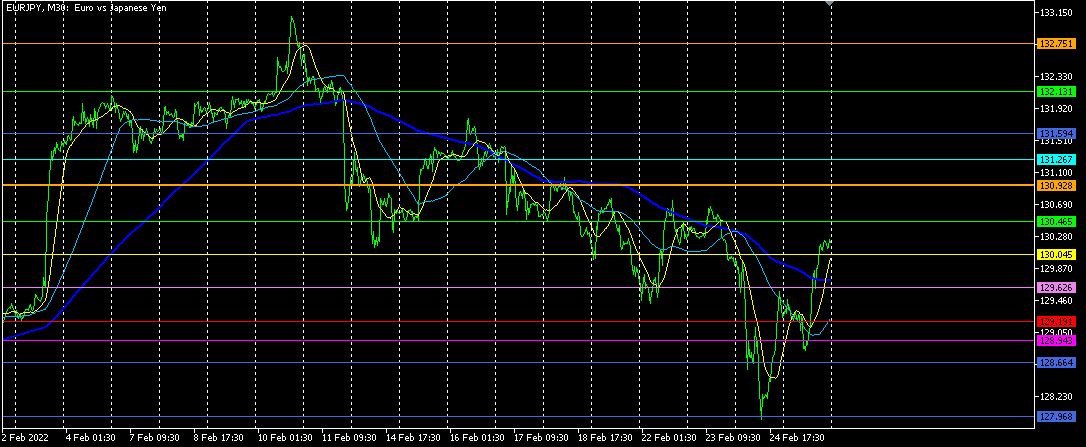
Indeed it fell again.SMA200-break to the downside would yield about230PIPS of profit. It dropped sharply on Thursday and retraced, but has not yet reached the daily support line, so there is potential for further decline.
【My listed items】


