

This indicator is very popular for being easy to understand


We’ve already received very happy feedback from users who purchased it promptly!!
❝Win rate100%.
Thank you for your support.
Today, USDJPY movements were messy, soEURUSD was traded in the evening.
By focusing on avoiding wasteful trades,4trades and4
I only put in 10,000 yen, so it’s not a big profit, but
If I can invest 50,000 yen,I would be happy with 3wins.
I’ll continue to strive to report good news.❞
(東京都F.Sさん 男性)
❝This update is wonderful.
My meddling wife says, “This is easy to understand!”
The previous one seemed difficult, so we left it.
Thank you.❞
(愛知県T.Sさん 男性)
❝USDJPY five-minute chart shows only the mark,
combined with other indicators, I’ve achieved all wins,
and I’ve earned more than the price of Mebius. Thank you very much^_^
I bought after opening the email, and I truly thought this is a great product.
Previously I couldn’t figure out where to enter, so I gave up,
but with clear signals, the win rate is truly amazing, I’m grateful.
If I can keep earning, it seems my goals could be reached,
so I’ll do my best. ❞
(宮城県R.Kさん 女性)
❝Only moved for 2 days, but the arrows appeared at the decisive moment
This is a treasure (Holy Grail).
When I think back, my relationship with tensoko-sama started from the天底 chart
When I took a direct 1-hour course on binary options,
I thought, how enthusiastic he was and was drawn to him.
However, if that had guaranteed winning, everyone would be a billionaire.
Since then I bought many information products.
After going through the Mebius series, recently I stopped binary options
I don’t lose, but I also don’t win (this is the honest current state).
Because I want to break out of this,
I decided to buy since it’s inexpensive.
As I used it, I became drawn toMebius-V3indicator more and more.
Now my mind is full ofMebius-V3—I believe I can earn with it!
If I really couldn’t earn with this, I would stop FX!
Thank you very much.
(千葉県 Y.Yさん 男性)
Mebius-V3Screen layout
About arrow signs
- At the starting point where moving average bands cross,real-time it lights up. If conditions are not met before candle close, it will turn off.No repainting.
- An alert sounds when the sign lights.
About markings
- The markings on the indicator are not real-time; they display after the band shape is confirmed. (Marking on 1–2 candles later.)
- Not real-time lighting, but by reviewing the marking points and iterative learning, you can understand turning points, and with practice, you’ll know these points before they light up.Learning effect is outstanding!
Basic way to view entry points
In Mebius-V3 there are two lighting displays: the chart “arrow sign” and the indicator “marking.” These do not directly equate to entry points.
After understanding the movement and waveform of the indicator curves,you must decide on the signs and markings to take or discard.In particular, pay close attention to the indicator’smarking
【Points of arrow signs】
Arrow signs light in real time at the cross points of the blue and red moving average bands. The top image crosses cleanly and is easy to understand, but in choppy areas where the direction isn’t set, the bottom image shows signs lighting up alternately up and down. In such areas, do not force an entry; observe and choose a point that matches the markings.

【Marking at the winning shape】
When the indicator takes this shape, it goes up; when it takes this shape, it goes down
This is a “winning shape” to master to become a successful trader.
However, mastering this shape isn’t as easy as it sounds.
When you ask “What will happen next?”, questions arise.
Therefore, marking points are added at the moments when it might happen,
made easy for anyone to understand.
The basic way to view the start of rise or fall is the shape below.


Points of marking lighting
In an uptrend:
In the lower band, the pink band reverses and touches the blue band, and it rises from belowabove the blue band. The point where the pink and blue meet is thegreen marklighting point.
In a downtrend:
In the upper band, the pink band reverses and touches the blue band, covering from aboveas ifit drops below the blue band. The point where the pink and blue meet is thered marklighting point.
※In middle-range areas with relatively small waves, markings are cautious; look for markings from upper or lower bands’ larger waves.

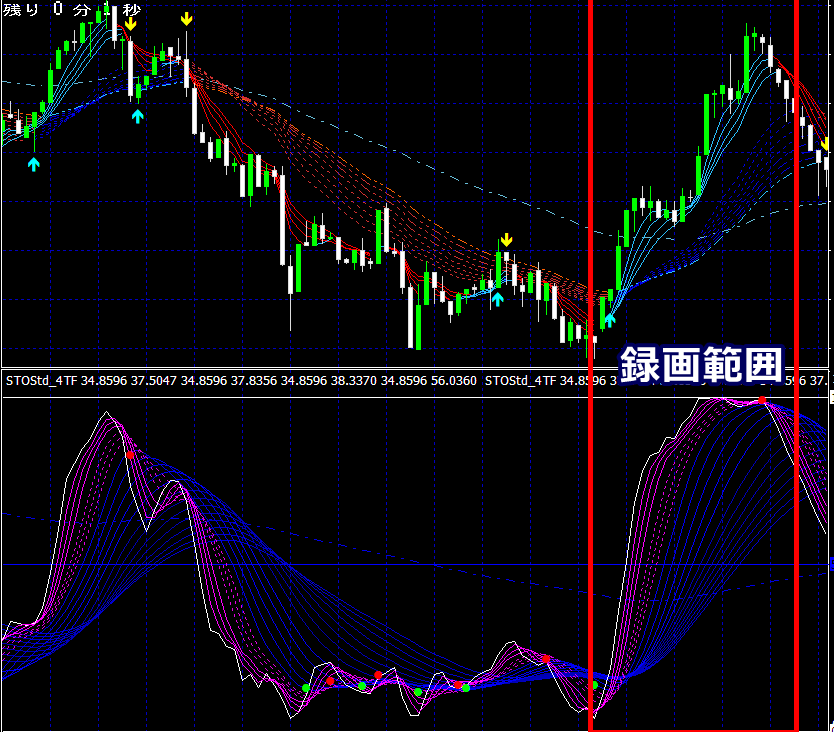
Actual lighting of Sign and Marking (video)
You can view the lighting of the arrow signs and markings on the Mebius-V3 indicator in a video.
Video is here https://youtu.be/KaqWgsK6ul (27 minutes 58 seconds)

Video is here https://youtu.be/P1XH4gcO35M (15 minutes 18 seconds)
Entry - Winning Pattern ①
①-1 Capture the fall from the upper limit area! In the upper limit area, the blue and navy bands converge and align horizontally.
In the upper limit, the pink band reverses into a “逆U字” shape and, covering the converged blue and navy bands,drops belowentry point occurs.
When the markings of the indicator and the arrow sign align, that’s best.
①-2 Enter on the rise from the lower limit!
At the lower limit, the pink band reverses into a “U-shape,” and it rises from below, lifting the blue and navy bands,breaking above
Entry - Winning Pattern ② (especially effective for binary options) ②-1 Capture the re-rise! (Perfect Order)
In a rising trend where moving averages are almost entirely blue in a perfect order, after a pullback, the pink band crosses above the blue and navy bands into the upper blank area, which is the entry point.
②-2 Capture the re-fall! (Perfect Order)
In a falling trend where moving averages are almost entirely red in a perfect order, after a retrace, the pink band crosses above the blue and navy bands and drops into the lower blank area.This is the entry point.
②-3 Capture the early fall! (early stage of decline)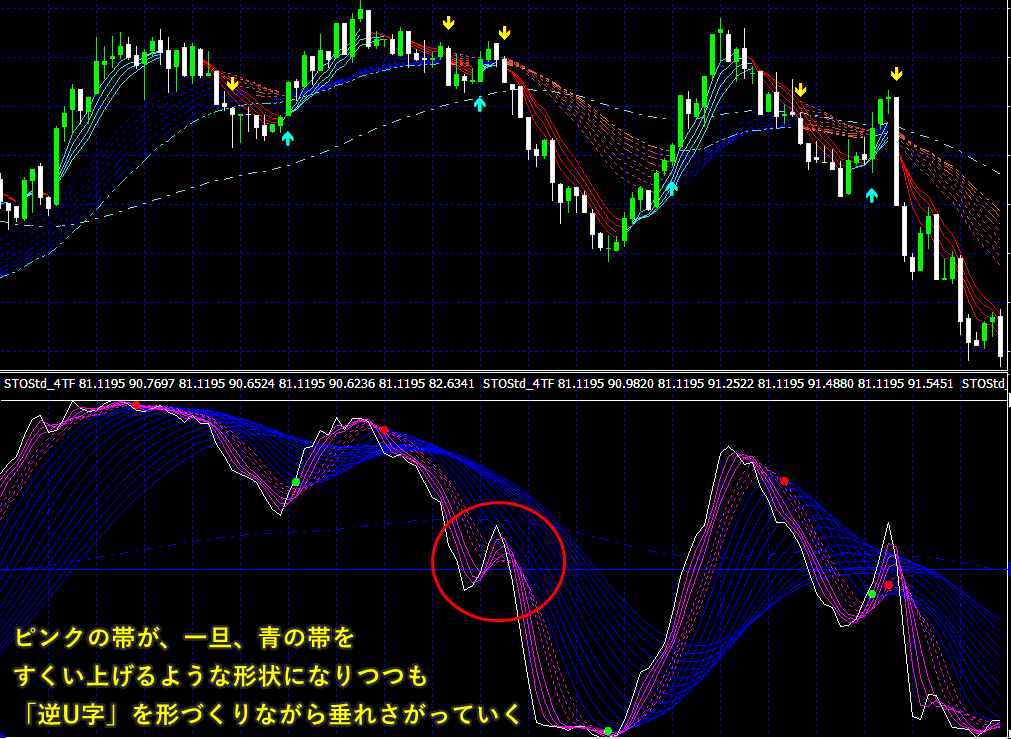
The pink band enters below the blue and navy bands; after turning from rise to fall, a retracement occurs, and it rises a bit to roughly lift the blue band before immediately forming a “逆U字” and dropping into the lower blank area—this is the entry point.
In early retracements of declines, this shape often leads to consecutive bearish candles, making this a particularly effective point for binary options.
Recommended timeframesTrading methods:
- Day trading
- Swing trading
- Binary options
Recommended currency pairs:- All currency pairs and Nikkei 225 supported
Recommended chart timeframes:
- For day trading: 5 minutes
- For swing trading: 1 hour
- For binary options: 1 minute
To what extent should you use the arrow signs?
I ran a backtest over the past year assuming you traded exactly according to all signs on a 1-hour chart.
Result: annualized return of 117%, which is a good result in itself.
Because of the nature of signs, during choppy or sideways markets, they will inevitably light up up and down, resulting in many unnecessary trades. The shorter the timeframe, the stronger this tendency becomes.
Fortunately, the arrow signs in Mebius-V3 always capture the initial turning point when there is large movement, so the data shows positive profits after removing unnecessary trades.However, we do not recommend entering mechanically according to signs alone.
We recommend combining with the indicator’s markings (the main feature) and selecting accordingly.
Importance of multiple timeframes!

The top two images are charts for the same time period.
When trading in real life, it is recommended to place charts of your chosen timeframe side by side with higher timeframes and view them simultaneously.
In a steadily rising or falling market, relying only on the base chart makes it difficult to determine the end of the move (top or bottom), so higher timeframes help determine the overall market position.
Also, when the base timeframe lacks a clear direction, viewing from a higher timeframe can help identify which direction the market is heading.Usually, one higher timeframe is sufficient, but in major markets, checking even higher timeframes is recommended.
- At the starting point where moving average bands cross,real-time it lights up. If conditions are not met before candle close, it will turn off.No repainting.
- An alert sounds when the sign lights.
- The markings on the indicator are not real-time; they display after the band shape is confirmed. (Marking on 1–2 candles later.)
- Not real-time lighting, but by reviewing the marking points and iterative learning, you can understand turning points, and with practice, you’ll know these points before they light up.Learning effect is outstanding!
| Points of marking lighting |
|---|
| In an uptrend: |
| In the lower band, the pink band reverses and touches the blue band, and it rises from belowabove the blue band. The point where the pink and blue meet is thegreen marklighting point. |
| In a downtrend: |
| In the upper band, the pink band reverses and touches the blue band, covering from aboveas ifit drops below the blue band. The point where the pink and blue meet is thered marklighting point. |
| ※In middle-range areas with relatively small waves, markings are cautious; look for markings from upper or lower bands’ larger waves. |

Video is here https://youtu.be/KaqWgsK6ul (27 minutes 58 seconds)
Video is here https://youtu.be/P1XH4gcO35M (15 minutes 18 seconds)
In the upper limit area, the blue and navy bands converge and align horizontally.In the upper limit, the pink band reverses into a “逆U字” shape and, covering the converged blue and navy bands,drops belowentry point occurs.
When the markings of the indicator and the arrow sign align, that’s best.
At the lower limit, the pink band reverses into a “U-shape,” and it rises from below, lifting the blue and navy bands,breaking above
In a rising trend where moving averages are almost entirely blue in a perfect order, after a pullback, the pink band crosses above the blue and navy bands into the upper blank area, which is the entry point.
| Trading methods: |
|---|
| |
- All currency pairs and Nikkei 225 supported
- For day trading: 5 minutes
- For swing trading: 1 hour
- For binary options: 1 minute


