
Impact of the tapering of quantitative easing on stock prices in the United States
0
In this FOMC, while there is flexibility regarding the size of the rate increase, the schedule, the pace, the reduction of the Fed's balance sheet, and the timing of its start, one thing is clear: rate hikes will occur, and balance sheet reduction will also take place.
A bit of a surprise in this FOMC is that the timing of balance sheet reduction seems likely to come sooner than expected. In response, interest rates rose, the dollar strengthened, and stock prices declined.
Consider the amount of excess money (the amount by which money in the economy exceeds what is needed).
Excess money is also known as "surplus money."
If this is large, typically more funds flow into stock investment, pushing up the price-earnings ratio (PER). The reverse is also true.
There are two metrics for excess money.
(1) Growth rate of M2 year-on-year – growth rate of nominal GDP year-on-year
M2 data is up to December last year, and GDP data is up to September.
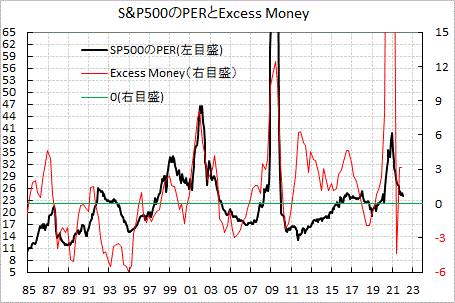
(2) Growth rate of M2 year-on-year – growth rate of (industrial production × producer prices) year-on-year
M2, industrial production, and producer prices GDP data are up to December last year.
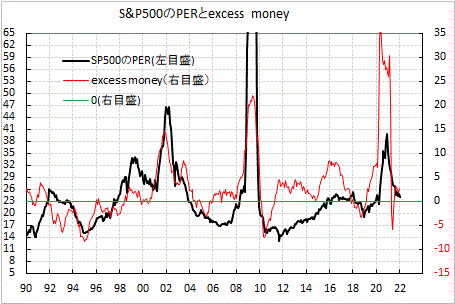
Therefore, hypothesizing that QE is being unwound — i.e., asset purchases are reduced ⇒ asset purchases end by early March ⇒ rate hikes begin ⇒ QT (Quantitative Tightening) by reducing holdings, and then estimating future excess money,
× ![]()