

Usage of the "Visualization Indicator" (Part 26)
“Visualization Indicator” usage (part26)”
1. Further evolve the “28 Currency Pair List Indicator” into an indicator
“8CPVisualization Indicator”to plotAUDNZD.
There are versions for Oceania,Oceania,London,NewYork,AnyCP versions. This time, Oceania version was used.
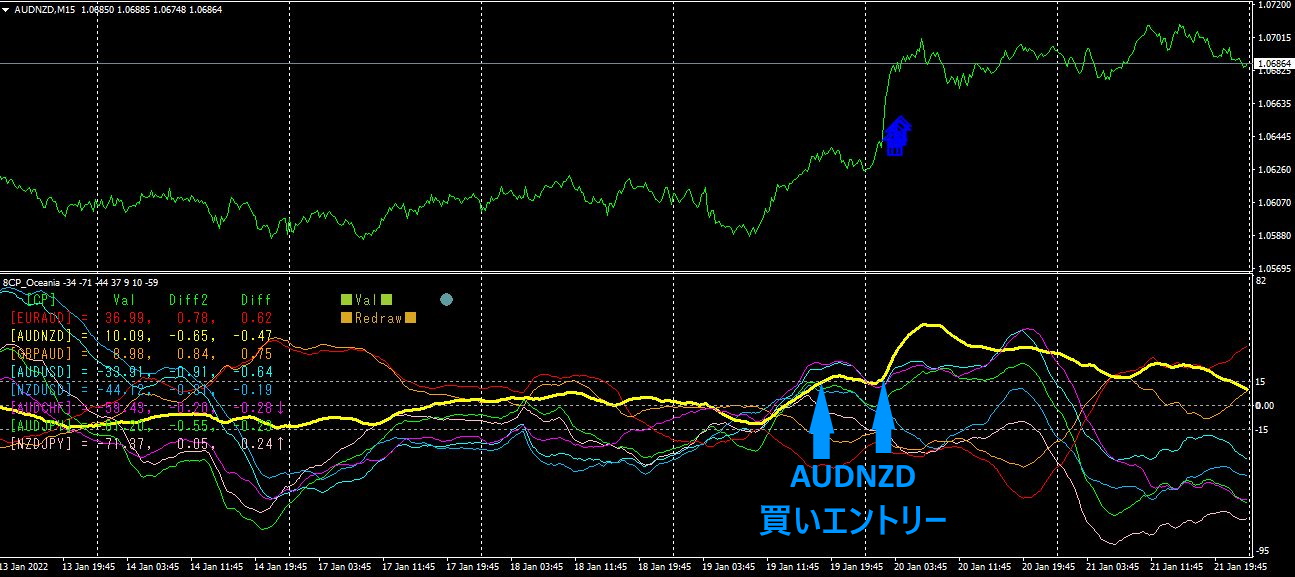
The top half is the 15-minute chart ofAUDNZD.15minute chart.
The upward blue arrows indicate the alert positions of the “28 Currency Pair List Indicator.”
The bottom half is the “8 CP Visualization Indicator.” The yellow bold line graph corresponds toAUDNZD.
From the alerts of the “28 Currency Pair List Indicator,” the buy entry point of the “8 CP Visualization Indicator” appears earlier. About70PIPSprofit was obtained.
2. Best SelectIndicator trial
1month21 day9:2228CP Best Select” indicator was displayed.
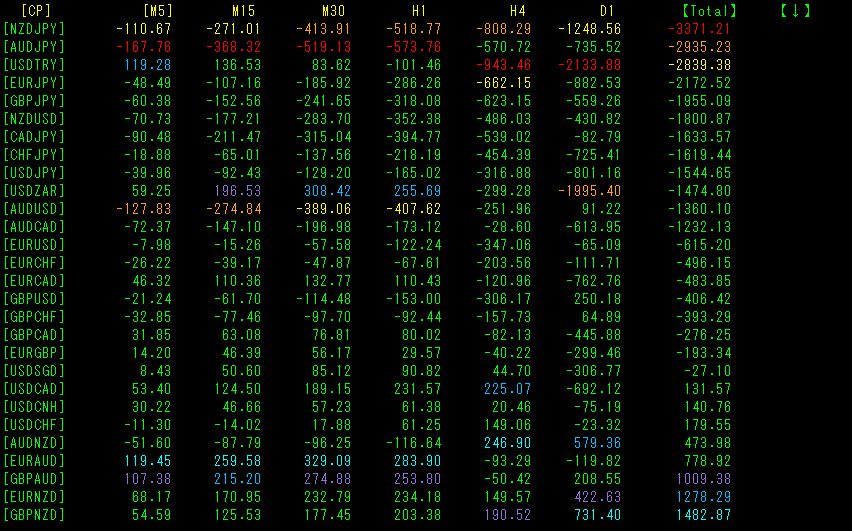
Sorted by total numerical values. The largest negative value isNZDJPY, followed byAUDJPY. If trading, the best pick isNZDJPY orAUDJPY to enter short. In particular,AUDJPY is shown in red from M5 up through H1.28 currency pair shows that the downtrend ofAUDJPY is the steepest. 5-minute, 15-minute, 30-minute, and 1-hour multi-time-frame analysis can be concluded at a glance from this table.
Now, let’s look at theAUDJPY chart. The chart is15 minutes.
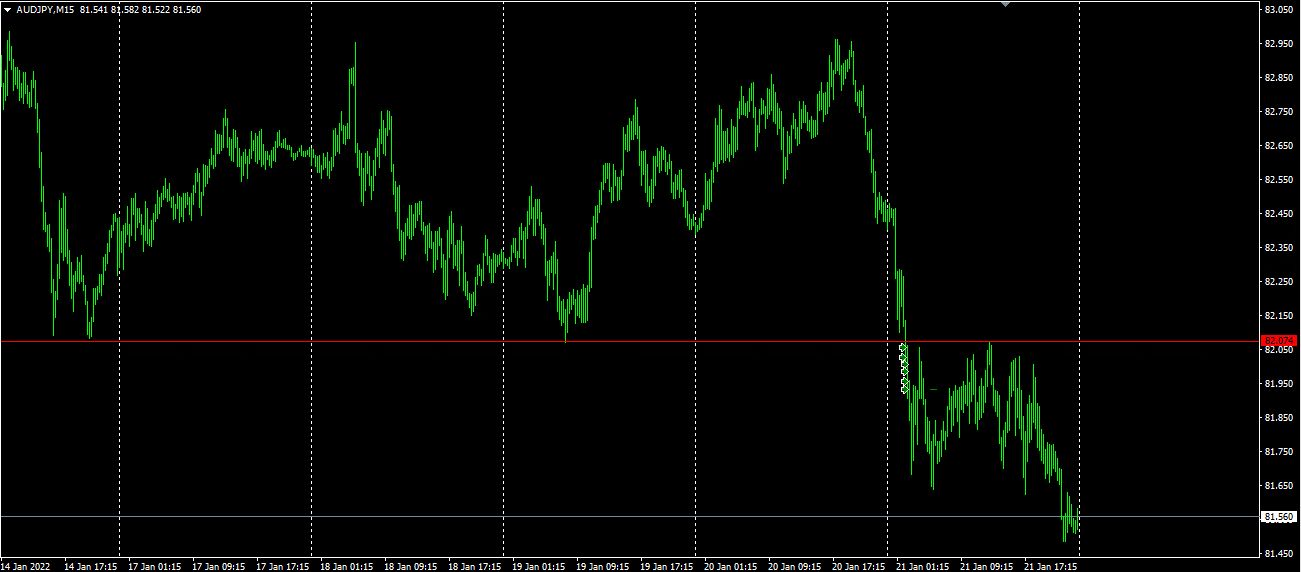
The red horizontal line is drawn at the most recent swing low. It has fallen sharply below the most recent low. If you enter at such a point, you’ll immediately have unrealized gains, so there is no risk of a reversal. When the first position becomes in profit, you add more short positions. In the above example, after successive additions, it became a total of6 short entries. All six hit the target profit, so I closed them early.
If held until night, it would have yielded more than50pips, but not being greedy and taking profits when targets are reached is the key to continuing trading without decreasing capital.
With the “28CP Best Select” indicator in hand, anyone can perform this kind of“classic trading”
3. Best SelectIndicator (CFD edition)
Using the “Any Symbol Best Select” indicator allows trading of CFDs (stock indices, commodities, etc.). This time, NASDAQ was traded.
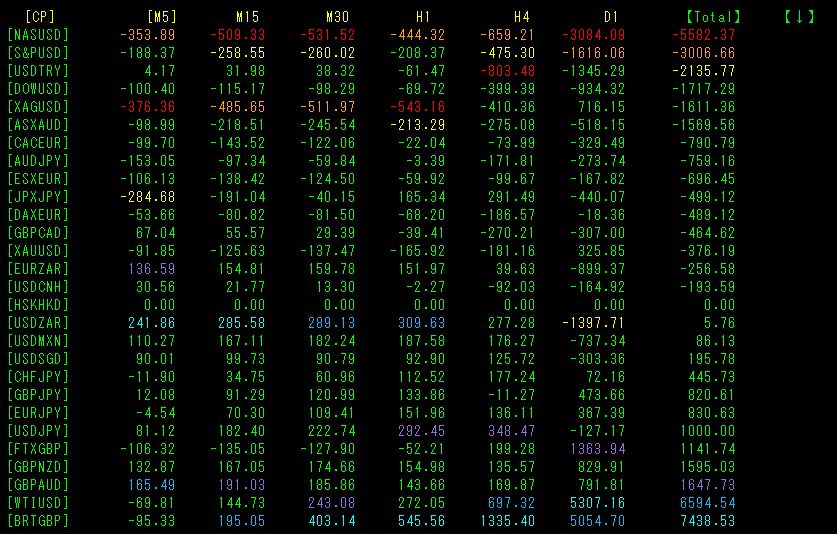
Totalvalues are sorted. For short trades, pickNASDAQ; for long trades, pickBRTGBP(crude oil).The numbers are negative, andD1 show red or orange color forNASDAQ.
Now, let’s look at the chart. The chart is15 minutes.
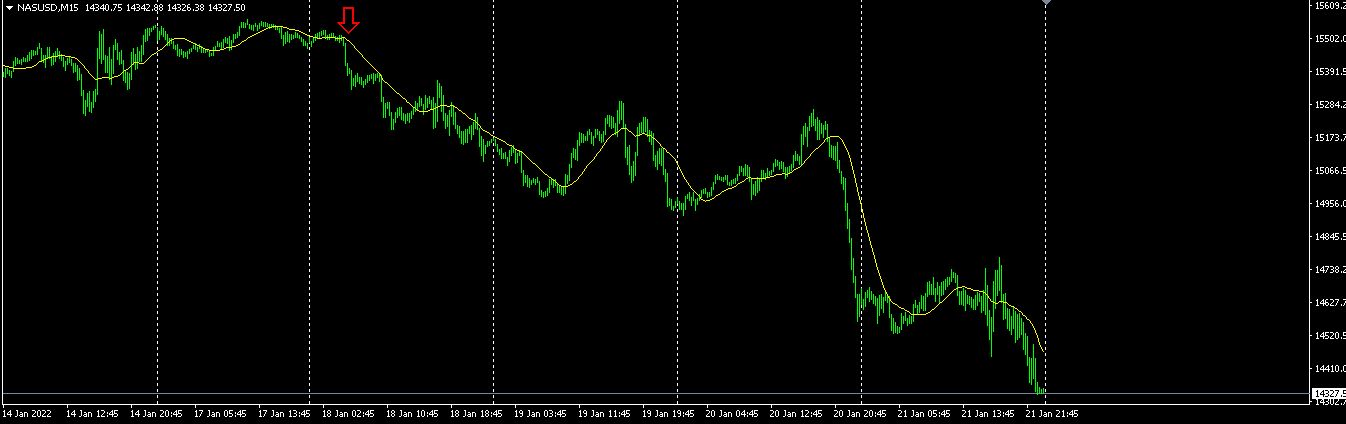
The red downward arrows indicate the position where the “Any Symbol Best Select” indicator was displayed.
It keeps falling. If held until the weekend, it would have produced enormous profits.
4. Since last year, May, what happened with EURJPY, which I’ve been tracking5 months?
Since May 2021, the movement of EURJPY has been tracked.
To view the overall trend, a 30-minute chart showing the most recent about3 weeks is drawn.
Last time I wrote the following.
The upward trend has ended, and from here it will follow a downward path. Wait for a pullback selling opportunity and attack with a sell trade.
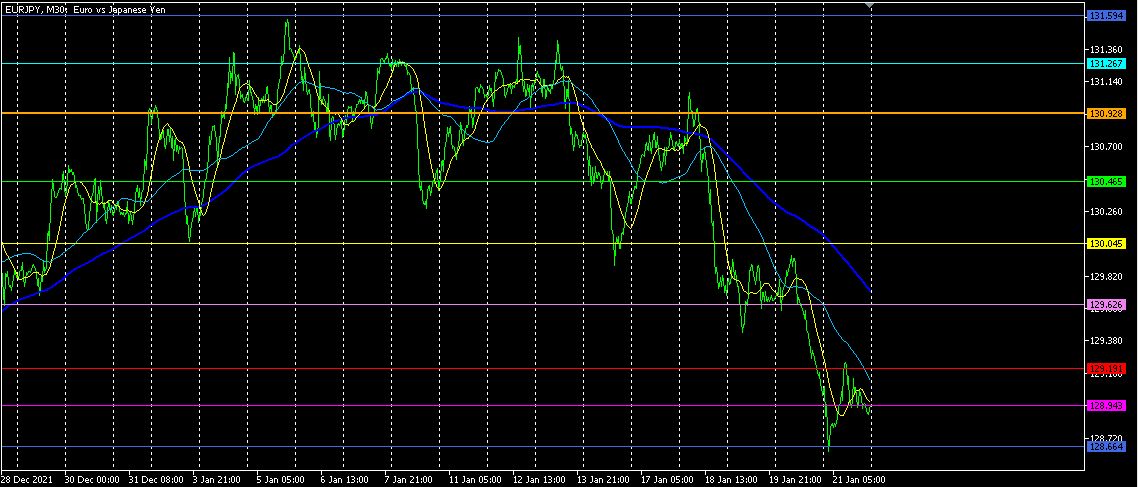
On Tuesday, the SMA200 rose above, but then failed to rise further, and after breaking SMA200, the price formed a two-step decline.SMA200 breakdown and selling would have yielded about210PIPS
There seems more to drop.
【My listed products】


