

Usage of “Visualization Indicator” (Part 21)
Utilization of the "Visualization Indicator" (part21)
“2828 Currency Pair List Indicator” blog content will also be posted.
1. Last week (2021 year12 month6 day ~12 month10 day) 「 Currency Pair List Indicator」
EURCAD
Last week, many alerts were for the currency pairEURCAD.
All alerts were selling alerts.
[EURCAD]
: Sell ↓ Val=-969.92 12Mon7 day18:04
[EURCAD]
: Sell ↓ Val=-1018.37 12Mon7 day18:09
[EURCAD]
: Sell ↓ Val=-998.60 12Mon7 day18:25
[EURCAD]
: Sell ↓ Val=-908.72 12Mon7 day18:49
[EURCAD]
: Sell ↓ Val=-923.80 12Mon7 day19:10
[EURCAD]
: Sell ↓ Val=-903.44 12Mon7 day19:19
[EURCAD]
: Sell ↓ Val=-822.01 12Mon7 day19:55
[EURCAD]
: Sell ↓ Val=-851.25 12Mon7 day20:04
[EURCAD]
: Sell ↓ Val=-872.25 12Mon7 day20:09
[EURCAD]
: Sell ↓ Val=-969.21 12Mon7 day20:14
[EURCAD]
: Sell ↓ Val=-979.62 12Mon7 day20:20
[EURCAD]
: Sell ↓ Val=-970.21 12Mon7 day20:30
[EURCAD]
: Sell ↓ Val=-1034.68 12Mon7 day20:39
[EURCAD]
: Sell ↓ Val=-1035.79 12Mon7 day20:49
[EURCAD]
: Sell ↓ Val=-1101.29 12Mon7 day20:54
[EURCAD] : Sell ↓ Val=-1129.66 12Mon7 day
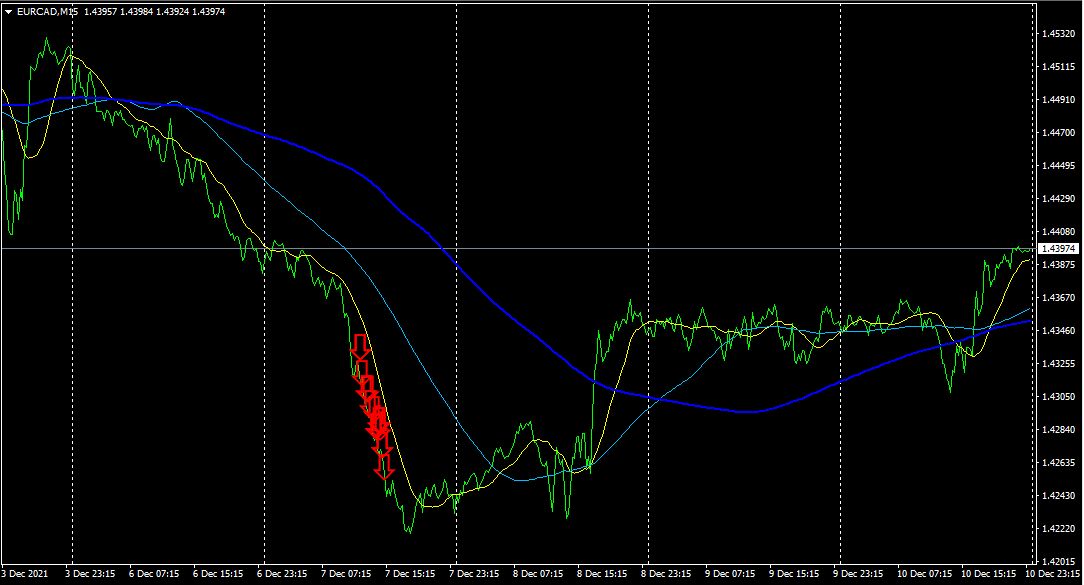
「28 Currency Pair List Indicator đã12月7日の売りアラートで売りポジションを建てていれば、100PIPS弱の利益になりました。
2. 「28通貨ペア一覧インジケータ」をさらに進化発展させインジケータ
「8CPVisualization IndicatorでEURCADを描く
「8CPVisualization Indicator」にはOceaniaLondon版、版、NewYorkAnyCP版があります。今回は、NewYork版を使いました。
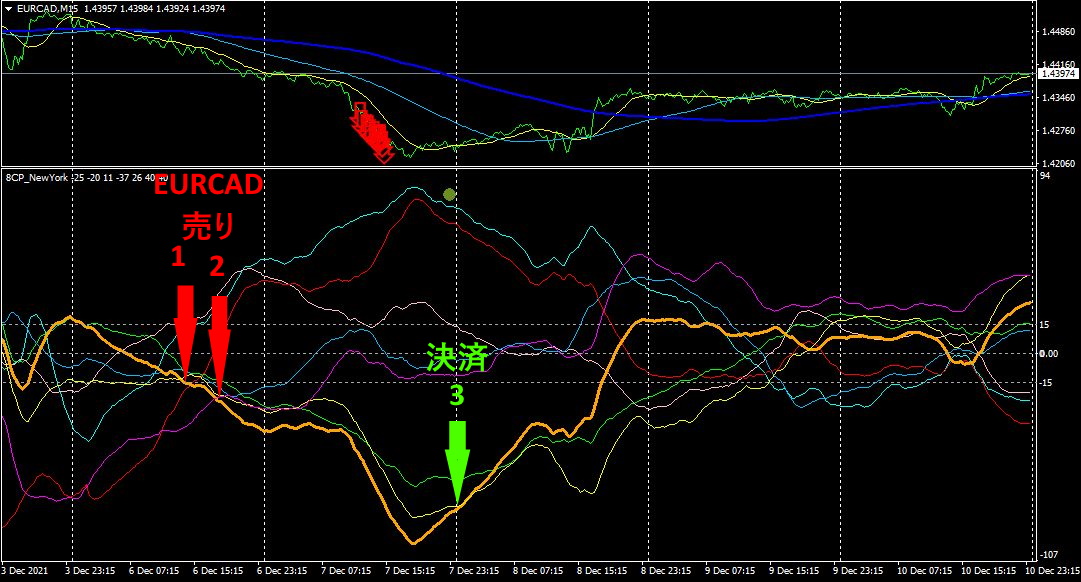
The top half is the EURCAD 15-minute chart, and the bottom half is the “8 Visualization Indicator.” The orange thick line graph corresponds toEURCAD.
The “8CPVisualization Indicator” starts giving selling entry points quite early (about1 day ago!). In the figure above, red arrows 1 and 2 are selling entry points, and green arrow 3 is the exit point.
Even if you entered a sell at red arrow 2, by the exit point you would have earned about180PIPS of profit.
Furthermore, the “8CPVisualization Indicator” also tells you it’s sufficient to buyCADCHF andCADJPY
Approximately70 PIPS
Approximately125 PIPS
In total for the two pairs above, about195 PIPS, and for the three pairs about375PIPS profit was possible...
This is likely the true power of the “8CPVisualization Indicator.
3. From 2021 year5 month10 day ongoingEURJPY movement, what happened?
Since 2021 year5 month10 day, we have been tracking
To view the overall trend, we have drawn about the last30 minutes over approximately3 weeks on a 30-minute chart.
Last time I wrote the following.
The downtrend continues after all. If the daily chart’s support/resistance line is broken downward, further decline is expected.
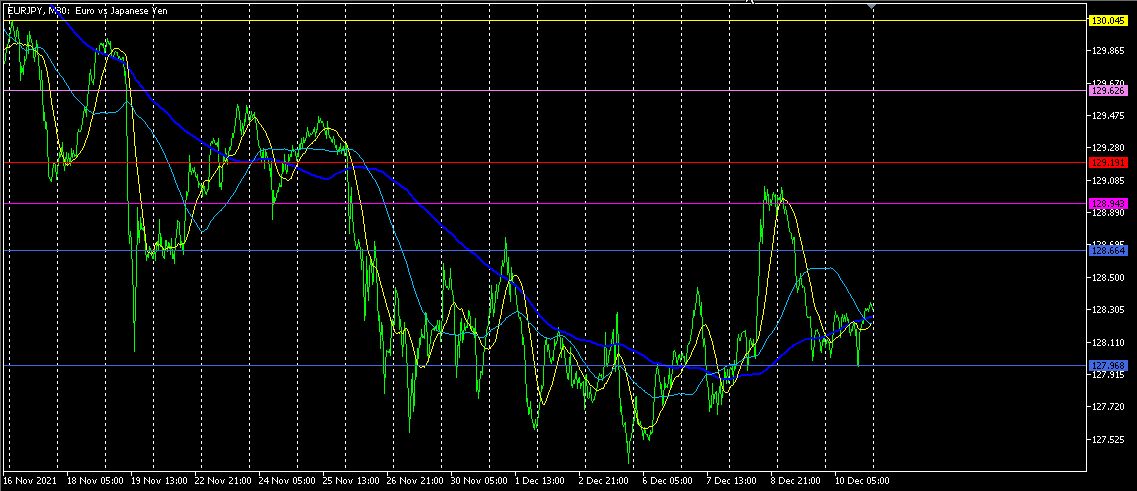
The daily support/resistance line could not be broken downward and rebounded. It seems consolidation will continue for a while.
※Other announcements※
The “28 Currency Pair BB Band Walk Indicator” has been developed into an EA,BandWalk Getter. In addition, a free indicator “Maintenance Rate Calculator” has been released on Gogojungle. It calculates and displays the maximum lots that can be opened based on the target maintenance rate, starting from the new order’s lot size. The “Maintenance Rate Calculator” is free, so please download and try it.
[My listed products]


