
【This Week's Trade Review】GBP/JPY December 6, 2021 - December 10, 2021 Results
No trading this week.

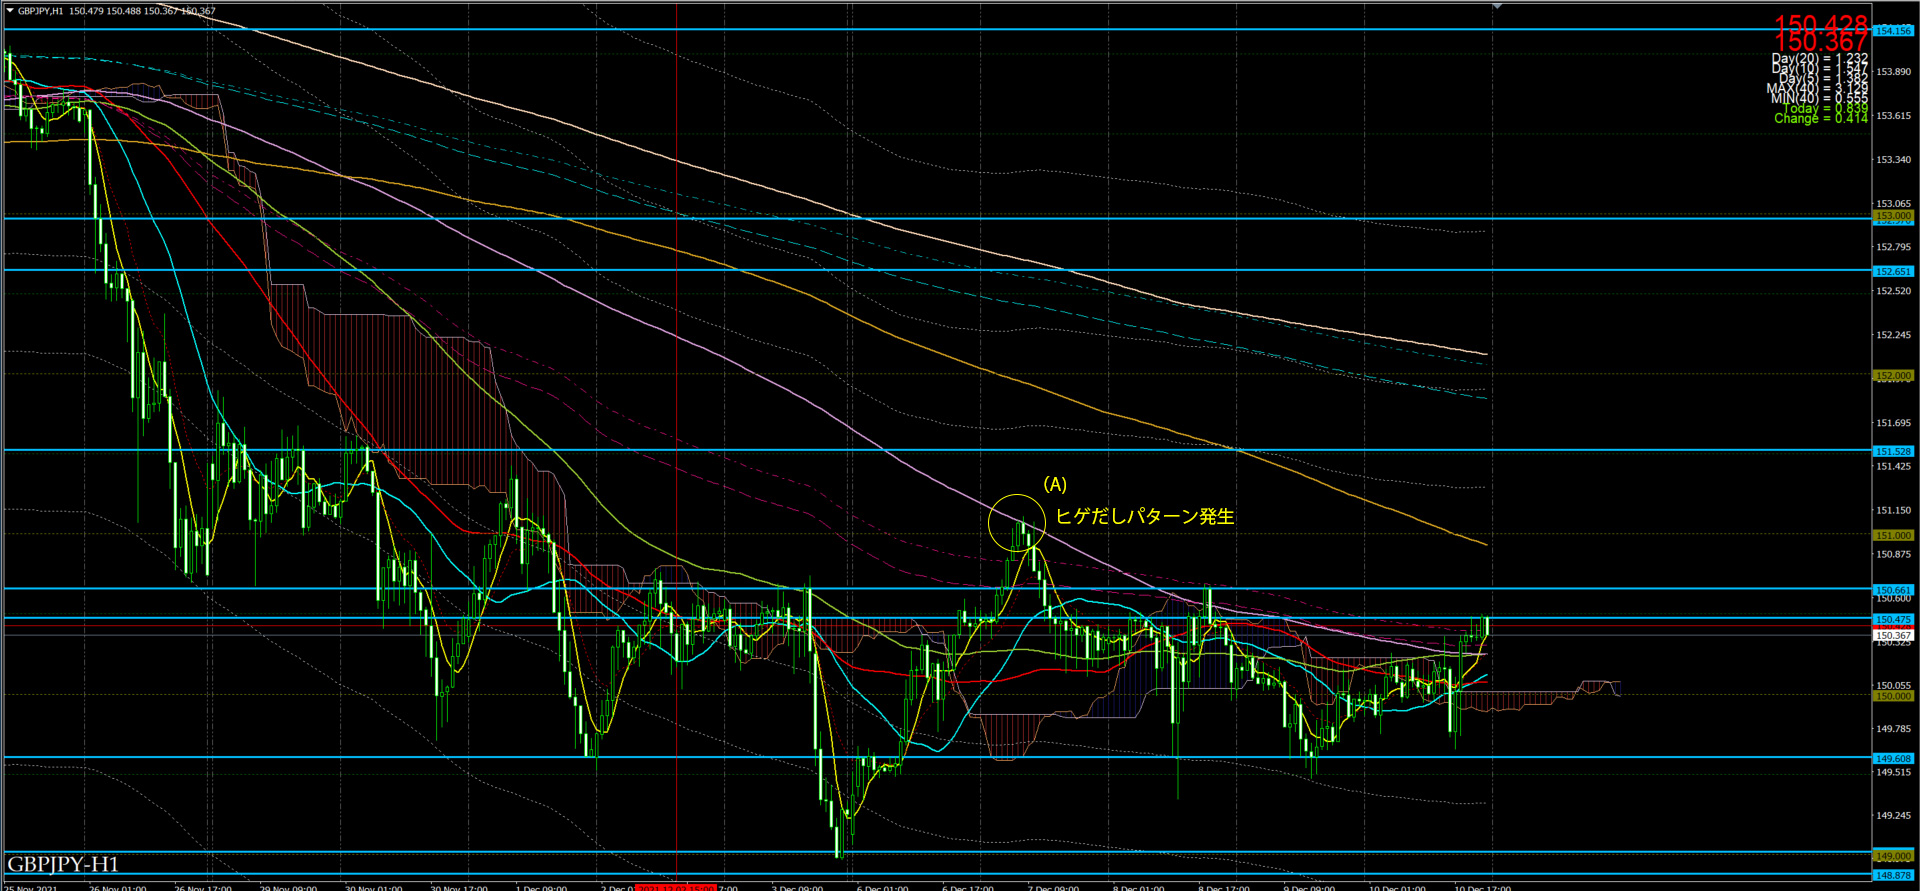
1-hour chart

4-hour chart
When reviewing the week's market
(A) was just a wick on the 200MA—could this have been the only trading point?
Also,

Looking at the weekly chart, a bullish candle formed. Is the 15.00 level acting as a resistance line after all?

Looking at the daily chart, the Friday close was almost exactly at 149.20.
Wouldn't it have been better to start the week with an upward bias?
------------------------------------------------------------
I am trading based on Ena-chan Sensei's “Close Price Trading Method.”
* The “exact pattern” refers to when the candle's close is at nearly the same level as the most recent close (often forming shapes like a double bottom or triple top), which is considered a resistance line and used as an entry method.
* The “wick-dashi pattern” refers to entering when the close aligns almost exactly with MA100, MA200, or MA300, with the expectation of a reversal.
------------------------------------------------------------
EA “OwarineDeEntry” that enters by placing a limit order at the close price
https://www.gogojungle.co.jp/tools/ebooks/29718