Learn everything about the Ichimoku Kinko Hyo — a 15-part video course —
“Only Sansei Ichimeizan knows the essence and utilization of Ichimoku Kinko Hyo.”
(Total 15 sessions - video course)
The familiar “Ichimoku Kinko Hyo” is well known, but
Did you know that the MT4 standard indicator is also included under the name “Ichimoku Kinkou Hyou”?
When you display the Ichimoku Kinkou Hyou that comes standard with MT4, it looks like this.
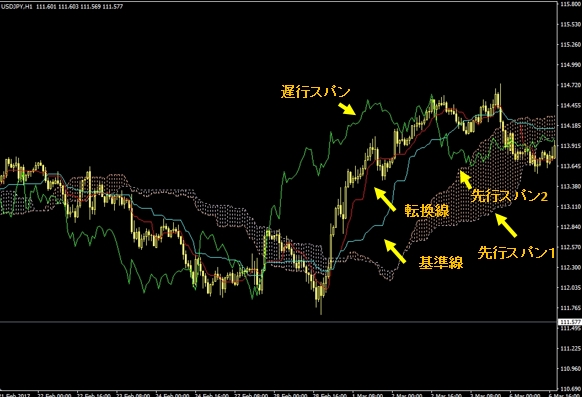
The area enclosed by Senkou Span 1 and Senkou Span 2 is what is commonly called the “cloud.”
In terms of trading methods and understanding using these,
• Buy when the candlestick breaks above the cloud, and sell when it breaks below
• The cloud tends to act as a resistance band, and thicker clouds imply stronger resistance
There are.
For those a little more advanced,
• When the candlestick and the Lagging Span cross, and the Lagging Span crosses above, buy; if it crosses below, sell
• If Tenkan-sen is below Kijun-sen, sell; if above, buy
• Three-line bullish reversal (Tenkan-sen above Kijun-sen, price above the cloud, and Lagging Span above the price) buy
That’s about how it goes.
But when you actually look at it,
“At a glance it looks messy and hard to understand…”
you may feel that way.
Moreover, since the Lagging Span is moving away from the current candle, you might not know if it crosses the candlestick without stepping back to view the bigger picture.
Trading on a cloud breakout may not work well…
There are people who say you can use Ichimoku Kinko Hyo, and people who say you cannot.
That is because the level of usefulness of Ichimoku Kinko Hyo is proportional to your level of understanding.
Even if you trade by blindly trusting the easy trading rules that flood the market, you will win and lose,
without understanding the “why” behind the wins and losses.
By gaining a correct understanding of Ichimoku Kinko Hyo, you will know why and be able to apply it to your trading.
This time, specially, from the video lectures we will introduce in detail the basic way to construct Ichimoku Kinko Hyo!
Just watching this will upgrade your way of reading Ichimoku.
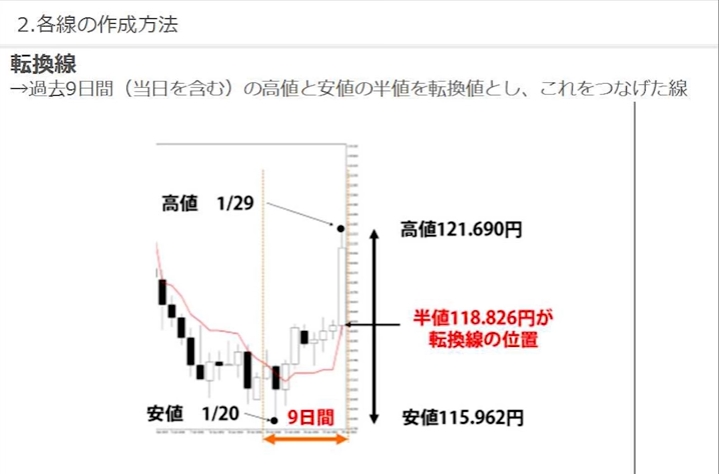
1. How to construct Tenkan-sen (Conversion Line)
2. How to construct Kijun-sen (Base Line)
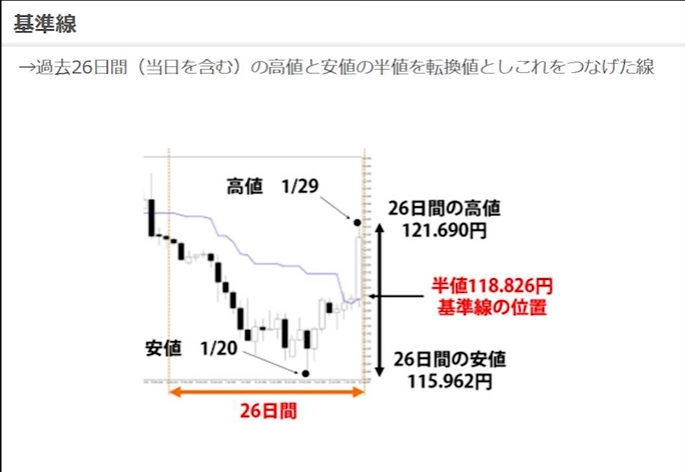
Tenkan-sen and Kijun-sen are like moving averages in other indicators.
(MA is based on closing prices)
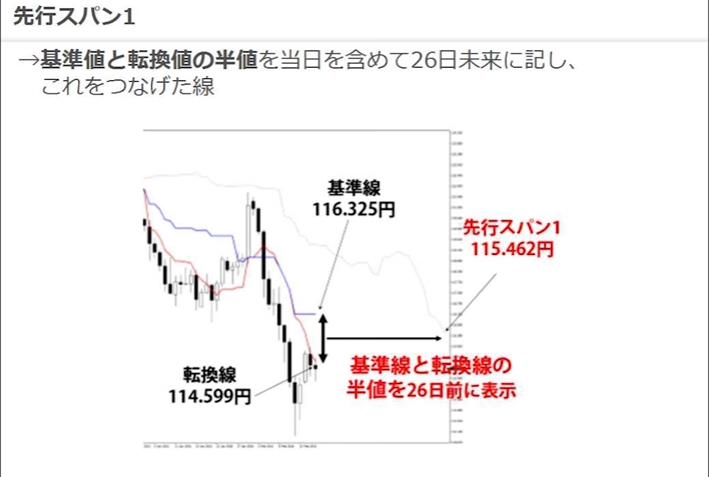
3. Senkou Span 1
4. Senkou Span 2
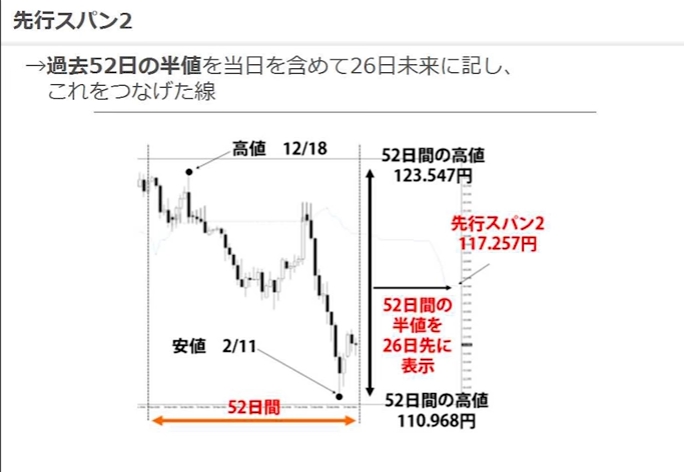
The interesting thing is that Senkou Span 1 and Senkou Span 2are moved into the future, you see.
If Senkou Span 1 (26 days) crosses above Senkou Span 2 (52 days), it is said to signal an uptrend.
Since past price ranges are displayed in the future, they become a temporary resistance band,
you can understand why!
5. Lagging Span
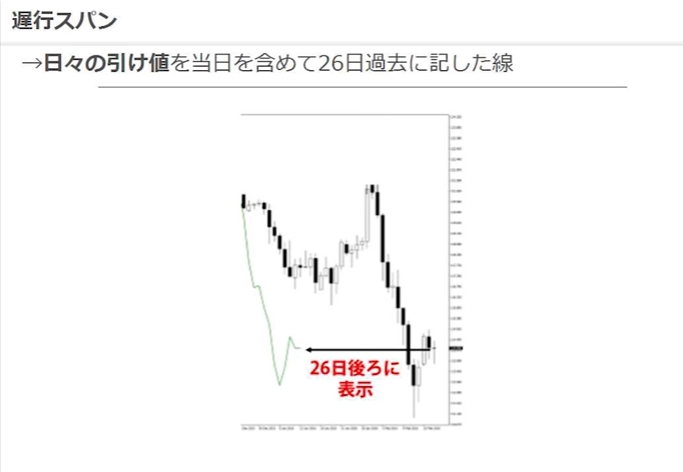
The Lagging Span is simply the closing price moved back 26 periods.
The phenomenon of the Lagging Span crossing above or below the price,
being above past highs or below past lows can be considered a breakout.
Now, with all of the above in mind, let's take another look at Ichimoku Kinko Hyo!
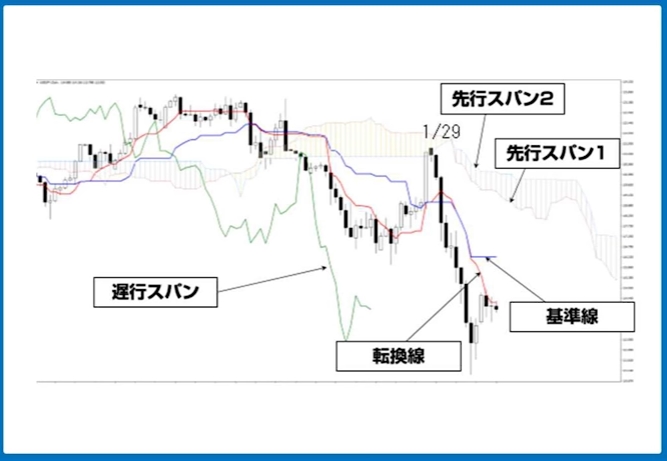
Has it become clearer and easier to read the chart?
So, how can you apply Ichimoku Kinko Hyo to trading?
The many little-known truths of Ichimoku Kinko Hyo,
will be explained in detail by Mr. Tetsuo Hosoda, the grandson of “Ichimen Yamajin” known as “Sansei Ichimeizan.”
The real truths about Ichimoku Kinko Hyo that are not widely known
■ (Three signals) Repeating buys and sells based on bullish/bearish turns shows a misplaced perspective!
■ The market either moves or doesn’t move.
■ A half retracement does not actually function in practice — where you set the starting point is subjective.
■ Ichimoku Kinko Hyo has a defined reference “period,” and the market changes based on it.
All 15 video sessions let you learn those secrets without missing anything.
And you will be able to read Ichimoku correctly, analyze the market, and forecast.
This is the video seminar for that.
Specifically…
• You will be able to forecast the duration of a consolidation phase!
• You will know the starting point of a consolidation market
• You will be able to forecast the duration of uptrends and downtrends!
• You will understand reversal signals based on the shape of waves!
• Weekly analysis enables you to anticipate major market turning points.
As you may have noticed, Ichimoku Kinko Hyo regards time as a very important factor.
In Ichimoku Kinko Hyo,“Time Theory,” “Wave Theory,” and “Price Range Observation Theory.” are the correct market analysis methods.
The table of contents for what you can learn in all 15 sessions is here!
The video seminar is set up so that one week's worth of content is added each week.
You will be able to continue learning Ichimoku while receiving weekly market analysis comments.
【Curriculum】
Session 1: Problems in how it's described and how it's used
Session 2: Ichimoku as support and pullback
Session 3: Ichimoku and the Spans
Session 4: Ichimoku and the Spans, Part 2
Session 5: Will the market move or not?
Session 6: The turning and deterioration of the Ichimoku
Session 7: How to perceive market direction, Part 1 – Trend-type analysis
Session 8: How to perceive market direction, Part 2 – Basics of price levels and wave theory
Session 9: Relationship between wave progression and Ichimoku – Part 1
Session 10: Relationship between wave progression and Ichimoku – Part 2
Session 11: Investment techniques are important too
Session 12: Focusing after the preparation structure
Session 13: How Sansei Ichimeizan conveys (what the original text means)
Session 14: Common problems in Ichimoku Kinko Hyo explanations
Session 15: Mr. Hosoda's personal views and simplification
The lecture videos can be watched repeatedly, with abundant bonuses and a feature to ask questions directly to the instructor.
The latest version is here