

November 21 Pound-Dollar Buy/Sell Strategy
↓ Pound/GBP, 1-hour chart
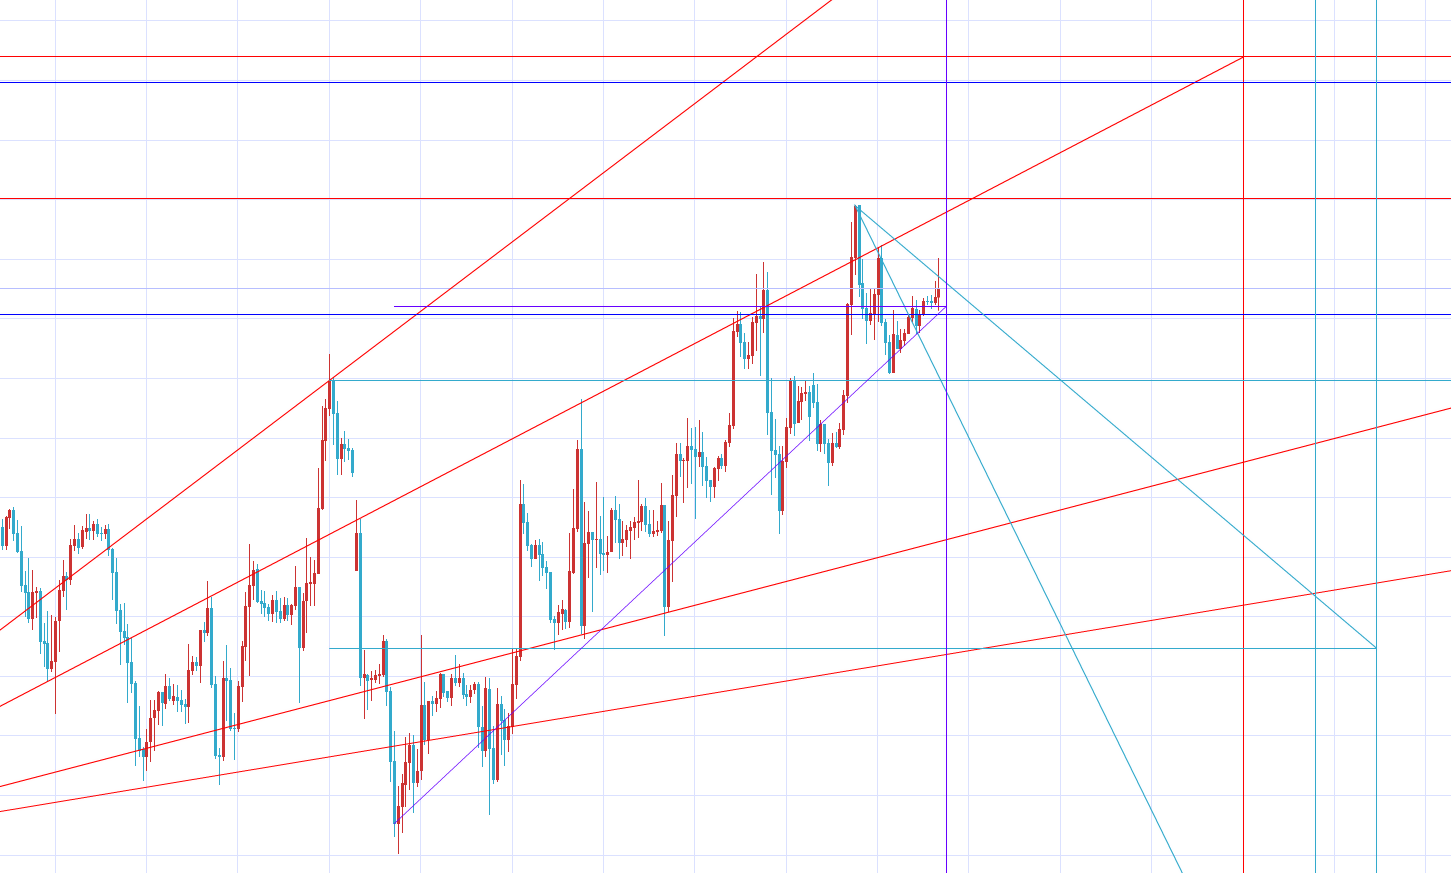
Riding the bullish impulse on the daily chart and cautiously testing higher levels,
since the end of last week it has been fluctuating around a daily-level sell zone.
Moreover, even though the rising 3-wave from the starting point at 16:00 on November 3 left a residual impact, today between 20:00 and 21:00
the time-out is approaching, suggesting a heavier move to the upside.
Looking at the daily up-move, it has not quite reached the minimum target value NT 1.32800.
As long as the starting point is not broken, time decay will extend into year-end, so there is upside room.
If aiming for the September high, first the upper bound of the rising intermediate wave at 1.3328 must hold, but
to reach this, it is necessary to surpass the upper edge of the large bearish candle at the policy rate announcement.
On the 1-hour chart, what becomes important in the declining wave is the bullish candle at 0:00 on November 11.
From the closing price of this bullish candle, waves have repeatedly formed and then been broken by the rising wave.
Since the rate has been above the starting point 1.32191 since the 17th, wherever the 3rd point is taken
the NT value will reach 1.32191.
Therefore, this line can be seen as an important support.
After the 1-hour chart rising wave times out, focus on the interaction with this line.
If entering short, within the daily sell zone 1.32412–1.33193
Try to sell with price close to the NT value of the daily rising wave NT value 1.32800 as much as possible.
Exit when the daily end price exceeds the upper bound of the rising intermediate wave at 1.3328.
If you want to limit risk, exit when the 1-hour close exceeds 1.32800 for 2–3 consecutive candles.
Take profit at the bullish candle close of 0:00 on November 11, 1.32191
Rotate in this range for a while
If entering long, from the bullish candle close at 0:00 on November 11, 1.32191
If the 1-hour close repeatedly falls below this level, retreat once
It would be better to re-enter from the lower daily rising wave reach line.
Take profit at the daily sell-zone lower edge 1.32412– daily rising wave NT value NT 1.32800
If the close reliably clears the 1.32412 line, raise the exit target to 1.32412 and add to the position
If it clears 1.32800, raise the target again and chase higher
However, since retracements selling will come in, it’s better to rotate appropriately for efficiency.
The blog also contains other useful information (=゜ω゜)ノ
http://blog.livedoor.jp/mkdesign_fx/


