

Utilization of the "Visualization Indicator" (Part 20)
“Visualization Indicator” usage (its20)
From this week, I will also post contents including the blog of “Currency Pair List Indicator”28.
1. Last week (2021 year11 month29 day~12 month3 day) the “28 Currency Pair List Indicator”
CADJPY
Last week, the currency pair that triggered many alerts wasCADJPY.
All alerts were sells.
[CADJPY]
: Sell ↓ Val=-808.48 11月29日17:55
[CADJPY]
: Sell ↓ Val=-836.60 11月29日18:00
[CADJPY]
: Sell ↓ Val=-1716.58 11月30日18:00
[CADJPY]
: Sell ↓ Val=-1245.70 11月30日19:05
[CADJPY]
: Sell ↓ Val=-905.63 11月30日22:25
[CADJPY]
: Sell ↓ Val=-930.14 11月30日22:35
[CADJPY]
: Sell ↓ Val=-966.51 11月30日22:40
[CADJPY]
: Sell ↓ Val=-903.65 11月30日23:50
[CADJPY]
: Sell ↓ Val=-999.09 11月30日23:55
[CADJPY]
: Sell ↓ Val=-911.45 12月1日02:40
[CADJPY]
: Sell ↓ Val=-1088.87 12月1日02:50
[CADJPY]
: Sell ↓ Val=-1004.06 12月1日03:05
[CADJPY]
: Sell ↓ Val=-908.57 12月1日03:20
[CADJPY]
: Sell ↓ Val=-1334.54 12月2日02:25
[CADJPY]
: Sell ↓ Val=-1428.62 12月2日02:30
[CADJPY]
: Sell ↓ Val=-1234.31 12月2日02:40
[CADJPY]
: Sell ↓ Val=-1370.29 12月2日02:45
[CADJPY]
: Sell ↓ Val=-1460.35 12月2日02:50
[CADJPY]
: Sell ↓ Val=-1731.83 12月2日02:55
[CADJPY]
: Sell ↓ Val=-1280.42 12月2日03:45
[CADJPY]
: Sell ↓ Val=-1615.62 12月2日03:50
[CADJPY]
: Sell ↓ Val=-1181.40 12月2日04:10
[CADJPY]
: Sell ↓ Val=-1422.41 12月2日04:15
[CADJPY]
: Sell ↓ Val=-813.49 12月2日21:10
[CADJPY]
: Sell ↓ Val=-1064.05 12月2日21:30
[CADJPY]
: Sell ↓ Val=-1185.63 12月2日21:40
[CADJPY]
: Sell ↓ Val=-1278.46 12月2日21:45
[CADJPY] : Sell ↓ Val=-822.59 12月2日
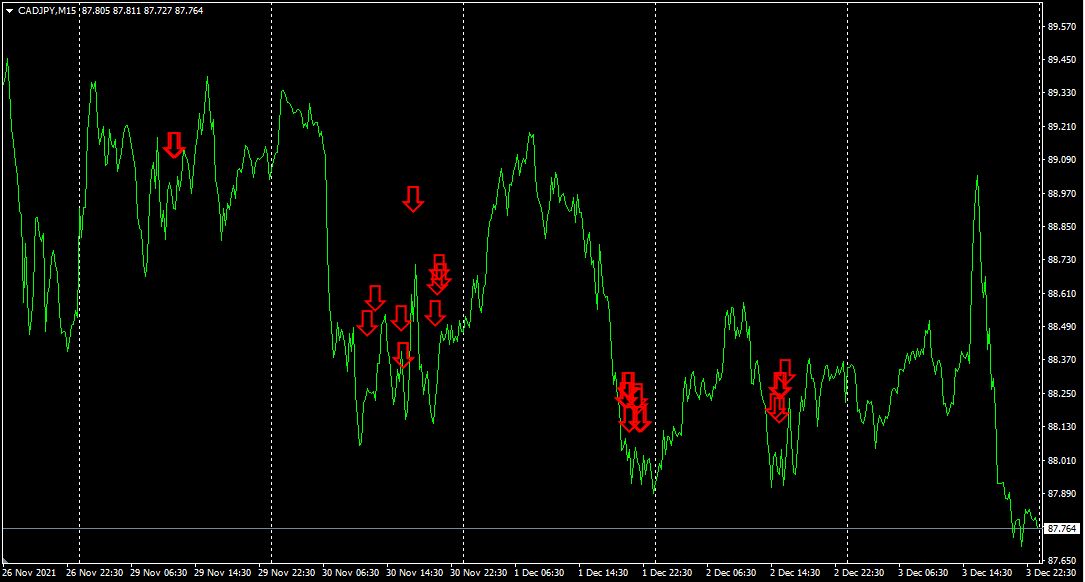
“28 Currency Pair List Indicator”s alert positions have red downward arrows displayed. There were many alerts, but they were all somewhat late and did not yield much profit.
2. I will further evolve the “28 Currency Pair List Indicator” into an indicator
“8CP Visualization Indicator”to drawCADJPY
The “8CP Visualization Indicator” includesOceaniaLondon version,NewYork version,AnyCP version. This time I used theNewYork version.
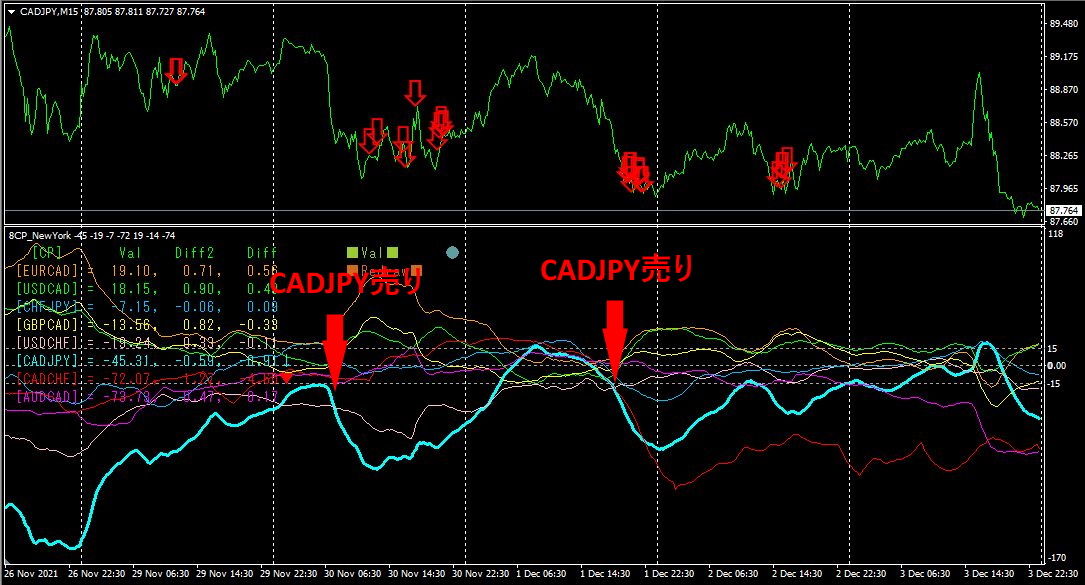
The upper half is theCADJPY 15-minute chart, and the lower half is the “8CP Visualization Indicator.” The light blue thick line chart corresponds to.
Again, the “8CP Visualization Indicator” provides sell entry points somewhat earlier.
3. From May 10, 2021, what happened to EURJPY, which I have been tracking?
I have been tracing EURJPY’s movements since May 10, 2021.
To view the overall trend, I have drawn roughly 3 weeks of the most recent 30-minute bars.
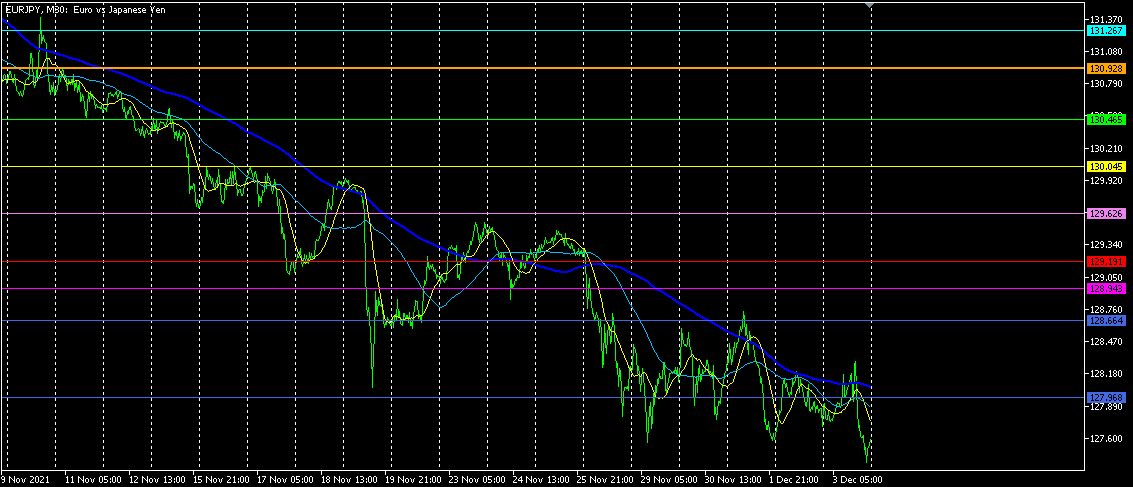
The downward trend continues. If the daily support-resistance line breaks below, further decline is expected.
※Other announcements※
We are actively developing the EA version of the “28 Currency Pair BB Band-Walk Indicator.” Also, a free indicator “Sustainability Calculator” (unreleased) is being developed concurrently. We plan to release both on Gogojungle as soon as they are ready, so please look forward to it.
【Products I have for sale】


