■ Dollar/Yen Buy/Sell Zones - Monthly
Because there are no major changes on the monthly chart, we will reuse last week's figure as is.
If the decline continues as is, it is possible to completely break through Buy Zone ④ around this week.
↓ Dollar/Yen Buy/Sell Zones - Monthly
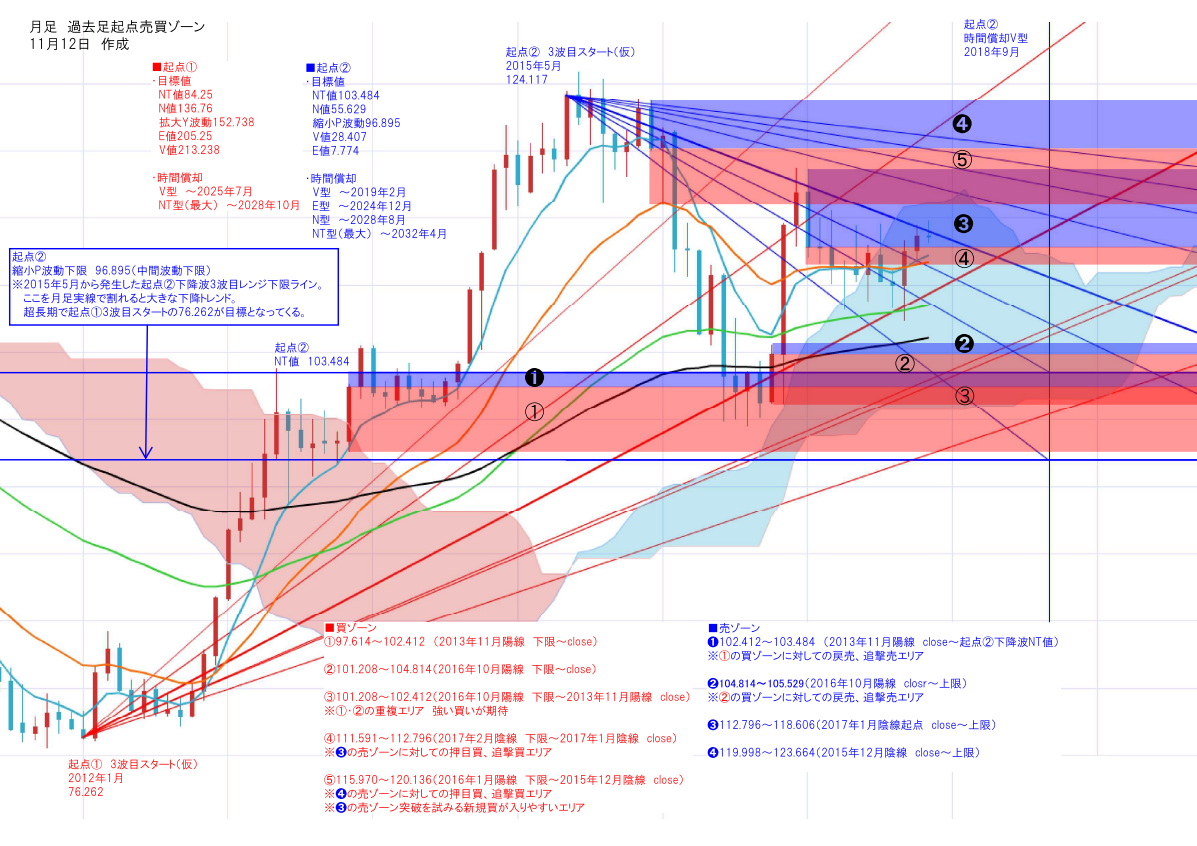
■ Buy Zones
① 97.614~102.412 (November 2013 bullish candle: low to close)
➁ 101.208~104.814 (October 2016 bullish candle: low to close)
③ 101.208~102.412 (October 2016 bullish candle low to November 2013 bullish candle close)
※ Overlaps of ① and ➁ are strong buying areas
④ 111.591~112.796 (February 2017 bearish candle: low to January 2017 bearish candle close)
※ A buying area for pullbacks and additional buys against Zone ③
➄ 115.970~120.136 (January 2016 bullish candle: low to December 2015 bearish candle close)
※ A buying area for pullbacks and additional buys against Zone ④
※ Area where new buys attempting to break through Zone ③ tend to enter
■ Sell Zones
➊ 102.412~103.484 (November 2013 bullish candle close to the starting point of the downward wave NT value)
※ Reversal and additional selling area against Buy Zone ①
➋ 104.814~105.529 (October 2016 bullish candle: close to upper limit)
※ Reversal and additional selling area against Buy Zone ②
➌ 112.796~118.606 (January 2017 bearish candle start to upper limit)
➍ 119.998~123.664 (December 2015 bearish candle close to upper limit)
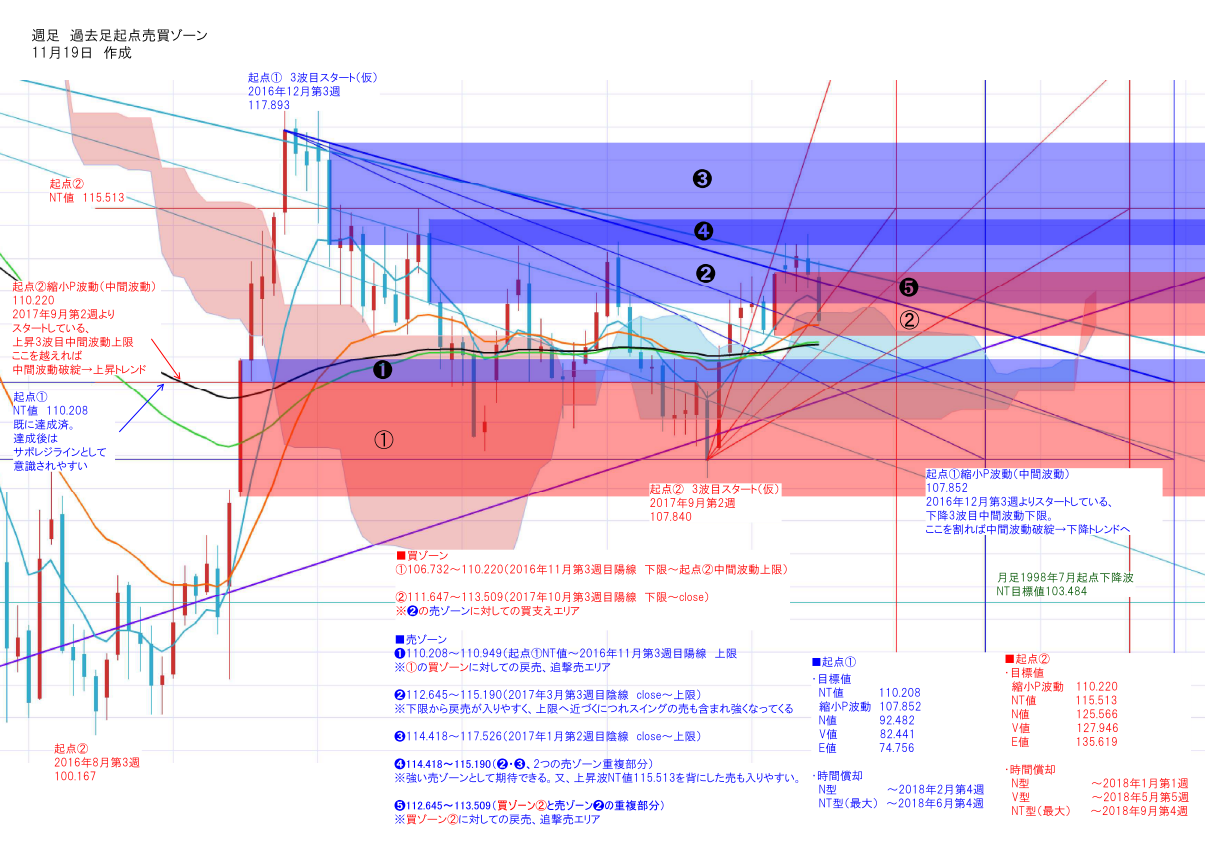
■ Dollar/Yen Buy/Sell Zones - Weekly
Because the rate dropped sharply at the end of last week, the weekly buy/sell zones have been updated.
↓ Dollar/Yen Buy/Sell Zones - Weekly
■ Buy Zones
① 106.732~110.220 (Third week of November 2016 bullish candle: low to the midpoint of the second starting wave)
➁ 111.647~113.509 (Third week of October 2017 bullish candle: low to close)
※ Support area for buying against Sell Zone ②
■ Sell Zones
➊ 110.208~110.949 (Starting point NT value to the third week of November 2016 bullish candle high)
※ Reversal and additional selling area against Buy Zone ①
➋ 112.645~115.190 (March 2017 third week bearish candle: close to upper limit)
※ There is a tendency for reversals from the lower limit, and selling pressure increases as it approaches the upper limit, including swing selling
➌ 114.418~117.526 (January 2017 second week bearish candle: close to upper limit)
➍ 114.418~115.190 (Overlap of ② and ③, two sell zones)
※ A strong sell zone is expected. Also, selling pressure is easier when supported by the rising NT value of 115.513.
➎ 112.645~113.509 (Overlap of Buy Zone ② and Sell Zone ⑦)
※ Reversal and additional selling area against Buy Zone ②
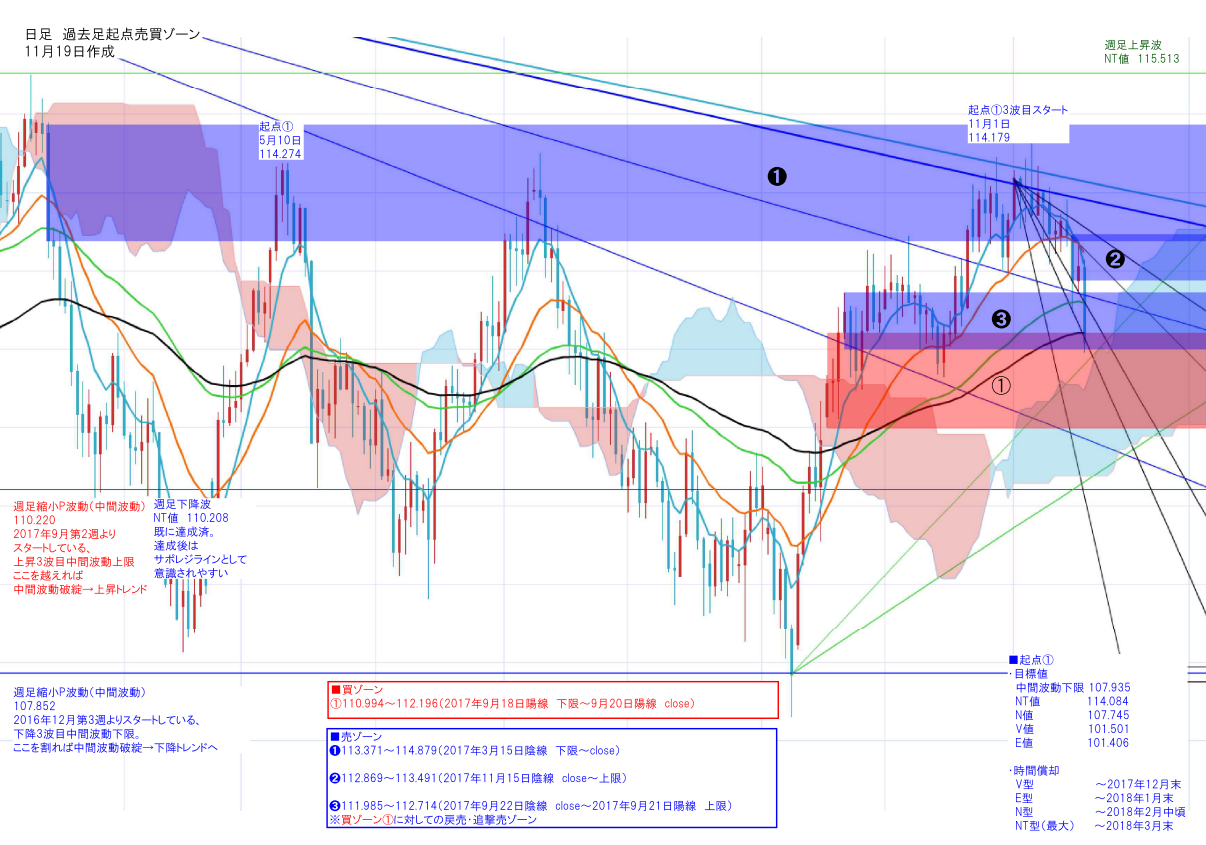
■ Dollar/Yen Buy/Sell Zones - Daily
Because the rate dropped sharply at the end of last week, daily buy/sell zones have been updated.
Each zone considers the most recent reaching lines up and down.
↓ Dollar/Yen Buy/Sell Zones - Daily
■ Buy Zones
① 110.994~112.196 (September 18, 2017 bullish candle low to September 20 bullish candle close)
■ Sell Zones
➊ 113.371~114.879 (March 15, 2017 bearish candle low to close)
➋ 112.869~113.491 (November 15, 2017 bearish candle close to upper limit)
➌ 111.985~112.714 (September 22, 2017 bearish candle close to September 21, 2017 bullish candle upper limit)
※ Reversal and exit selling zone against Buy Zone ①