4th Week of November Dollar-Yen Daily
The upward third wave, which supported the rise since September 8 on the daily chart, has expired in time, so it has been removed from the figure.
From the end of last week, it is noteworthy that the rate dropped significantly due to time decay.
This is a highly evaluative point in the wave structure.
In last week’s figure, the downward wave drawn provisionally has been formally adopted from this time.
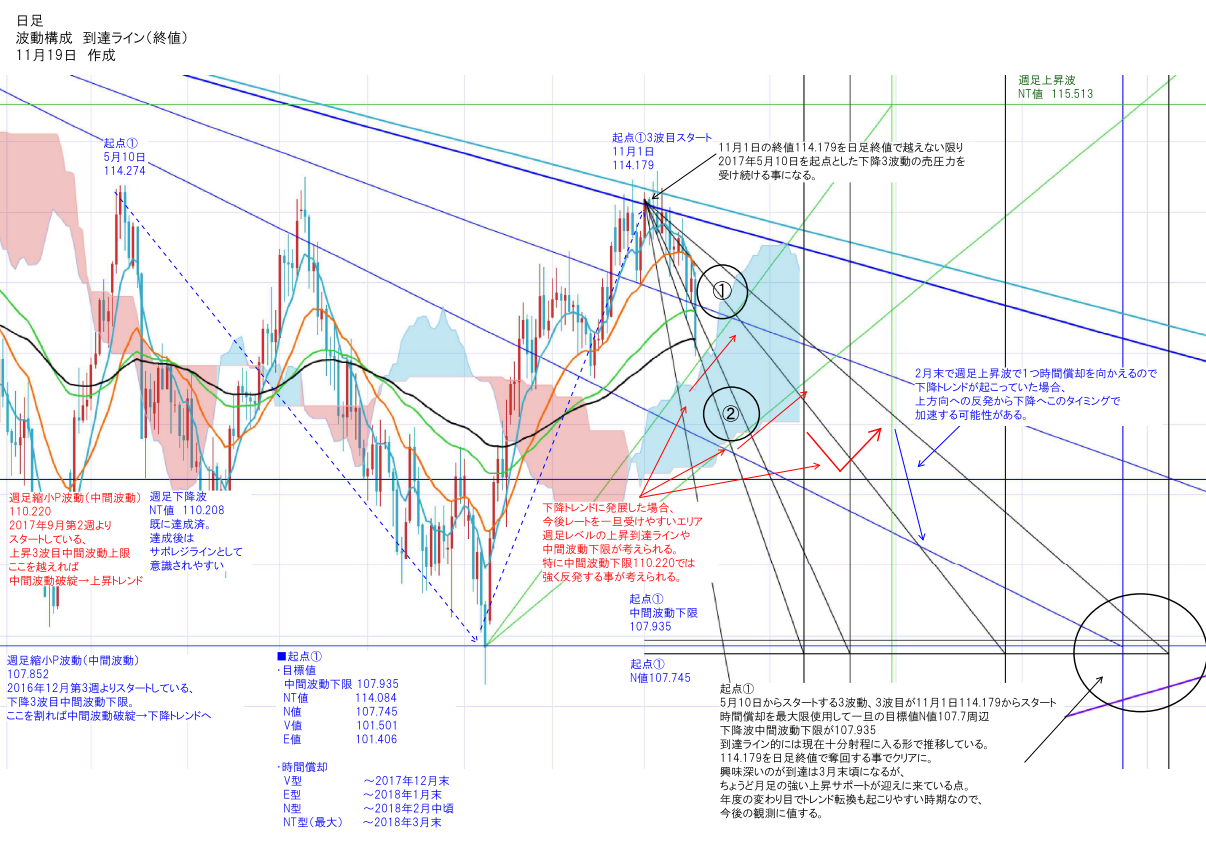
↓ USD/JPY Daily Chart Wave Structure (Close)
■ Figure format description
Monthly base upward reach line — purple diagonal
Monthly base downward reach line — light blue diagonal
Weekly base upward reach line — green diagonal
Weekly base downward reach line — blue diagonal
Daily base downward reach line — black diagonal
■ Other important lines
・Weekly downward wave shrinkage P-wave (intermediate wave) 107.852 blue
Lower bound of the intermediate wave of the third downward wave that began in the third week of December 2016.
If this breaks, the intermediate wave collapses → downward trend
・Weekly downward wave NT value 110.208 blue
Already reached; after reaching, it tends to be treated as support/resistance
→ In September’s rebound, it was broken through, and now serves as a support on the downside.
・Weekly upward wave shrinkage P-wave (intermediate wave) 110.220 red
Upper bound of the intermediate wave of the first upward three-wave sequence that began in the second week of September 2017
If this is surpassed, the intermediate wave fails → upward trend
→ In September’s rebound, it was breached, and going forward becomes support for the upward wave.
・Weekly upward wave NT target 115.513
A point that tends to become the target if the daily upward wave finds the next starting point
・Starting point ① daily downward wave intermediate wave lower bound 107.935
From 114.179 when the third wave starts, it first heads toward 107.935 to be sold off.
If this line is broken, a major downward trend will reverse
Therefore, buy orders are more likely to come in from this lower bound.
■ Movement from the start of the week
The target at the top is first the area marked by black circle ①
Rate tends to get caught at the weekly downward wave reach line or the daily downward wave reach line,
and even if it rises, it tends to face resistance and struggle to extend gains.
Starting the week, it is in a position where it can receive support from the weekly upward wave reach line, but
the weekly downward reach line is also pressing on the rate.
I will watch whether the rate touches which side when the weekend high/low lines intersect.
If the weekly upward wave reach line is broken early, I would target black circle ②.
If Monday ends with a bearish candle, the short-term EMA (8) (21) will retrace to the next downward wave reach line and DC,
raising the risk of accelerated decline.
■ Future outlook (bearish scenario)
As a somewhat distant forecast, consider what happens if the rate rides the downward wave of May 10.
A realistic target is around 107.935, the lower bound of the intermediate wave, and around 107.745 (NT value).
I drew lines for each timeframe (black diagonal).
Support could be expected at the intersection with the weekly upward wave and
around 110.208–110.220 where the weekly upward wave intermediate wave and the weekly downward wave NT value overlap.
If this area becomes a base, the price could again form an upward three-wave structure starting from September 8, with 115 range in sight.
Conversely, if the rebound is weak, expect a decline along the downward reach line.
Since by the end of February 2018, the time decay of the weekly upward wave will complete one cycle,
there may be a acceleration downward at that timing.
What is interesting is that the downward reach is around late March,
right when the monthly chart’s strong upward support is arriving.
As the year turns, trends are prone to reversal, so this is worth further observation.
(Bottom right black circle)
The above bearish scenario will continue unless the close of November 1’s 114.179 on the daily chart is recovered.
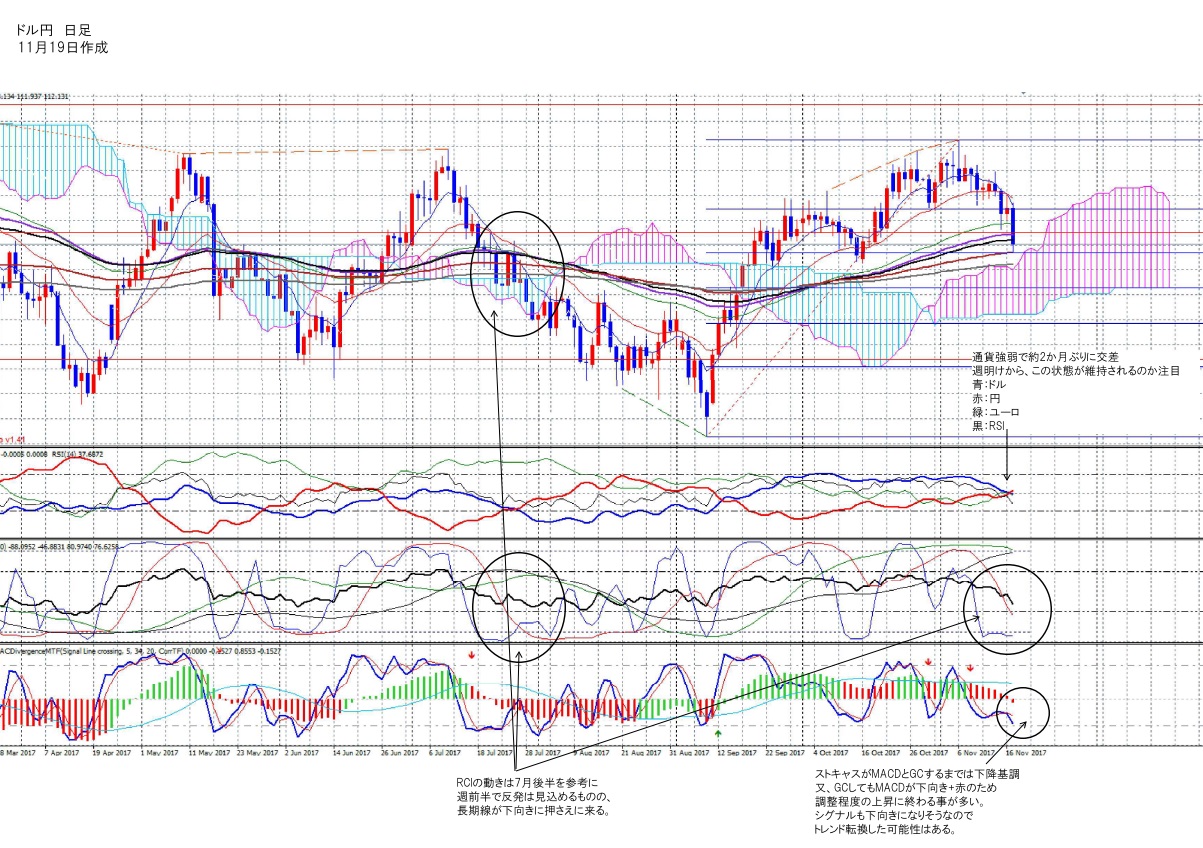
■ Check with the oscillator for the current stance
↓ USD/JPY Daily Chart from MT4