

4th week of November USD/JPY weekly chart
Continuing from the monthly chart, we will check the weekly chart.
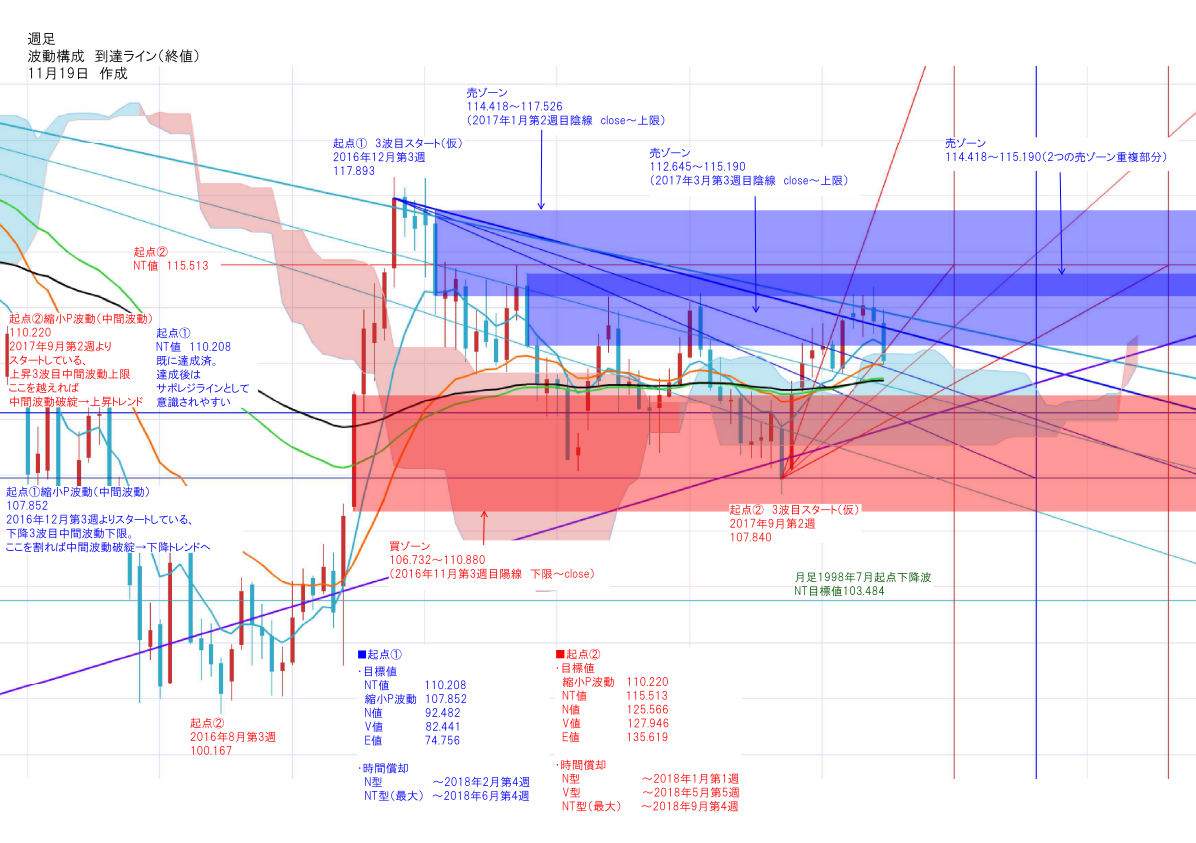
↓ USD/JPY Weekly Wave Structure (Closing price)
■ Description of the figure format
Monthly-based upward reach line - purple
Monthly-based downward reach line - light blue
Weekly-based upward reach line - red
Weekly-based downward reach line - blue
■ Other important lines
・Origin ① Declining wave retracement P-wave (middle wave) 107.852 blue
Starting from the 3rd week of December 2016, the lower bound of the middle wave of the 3-wave decline.
If this is breached, the middle wave collapses → to a downward trend
・Origin ① Declining wave
NT value 110.208 blue
Already achieved; after achievement, tends to be recognized as a support/resistance line
→ Breaks through with the September rebound, now serves as a support
・Origin ② Rising wave retracement P-wave (middle wave) 110.220 red
Starting from the 2nd week of September 2017, the upper bound of the rising 3rd wave middle wave
If surpassed, the middle wave collapses → to an upward trend
→ Breaks through with the September rebound; future support for the rising wave
・Origin ② Rising wave
NT value 115.513 red
Since the rising wave retracement P-wave 110.220 has been exceeded by the rate, it becomes the next target for buyers.
■ Last week's price movement
Tried the monthly downward reach line from last week with a higher price but was pushed back again and fell significantly.
Thus, this line has been tested four weeks in a row.
Last time in December 2016, this line was tested four weeks in a row and subsequently fell sharply the following week.
However, this time, unlike last time, the EMA at the low has caught up as support.
Considering the monthly upward reach line is present,
I do not expect a one-week 2–3 yen plunge as in the previous instance.
■ Points of focus from this week
① Whether the weekly upward reach line is supported and tests higher prices
② Whether the weekly downward reach line touched at the weekend provides a temporary bottom
③ If it pulls back, whether the medium-to-long-term EMA provides support
④ Whether the short-term EMA (8) (light blue) can rise without breaking the upward wave reach line
① The upward reach line moving toward the 115 yen range is passing around last week's low
Since the short-term EMA (21) is also approaching as support, monitor whether there can be a rebound at the start of the week.
② The weekly downward reach line touched at last week's end.
Whether it moves with upper and lower shadows toward the year-end, or it declines, pay attention to this week's movement.
③ In the low-110 yen range, the medium-to-long-term EMA (55) and (89) are crossing.
If these are broken on the weekly close, it would be a difficult scenario for buyers.
④ If the EMA aligns with the upward reach line and DCs (deviates), the upward pressure will weaken.
Recently, at the end of September, all EMAs supported the rate at the reach line and DC'd,
which weakened the upward pressure on the USD/JPY in October.
At the end of October, the mid- and long-term EMAs' crossing beneath the lower upward reach line contributed to
the bearish candle in the second week of November.


