

4th week of November – USD/JPY monthly chart
USD/JPY, we will also review the monthly chart this week.
At the end of last week it was a doji, but at the close of this week it changed to a long upper shadow bearish candle.
↓ USD/JPY Monthly Wave Structure (Close)
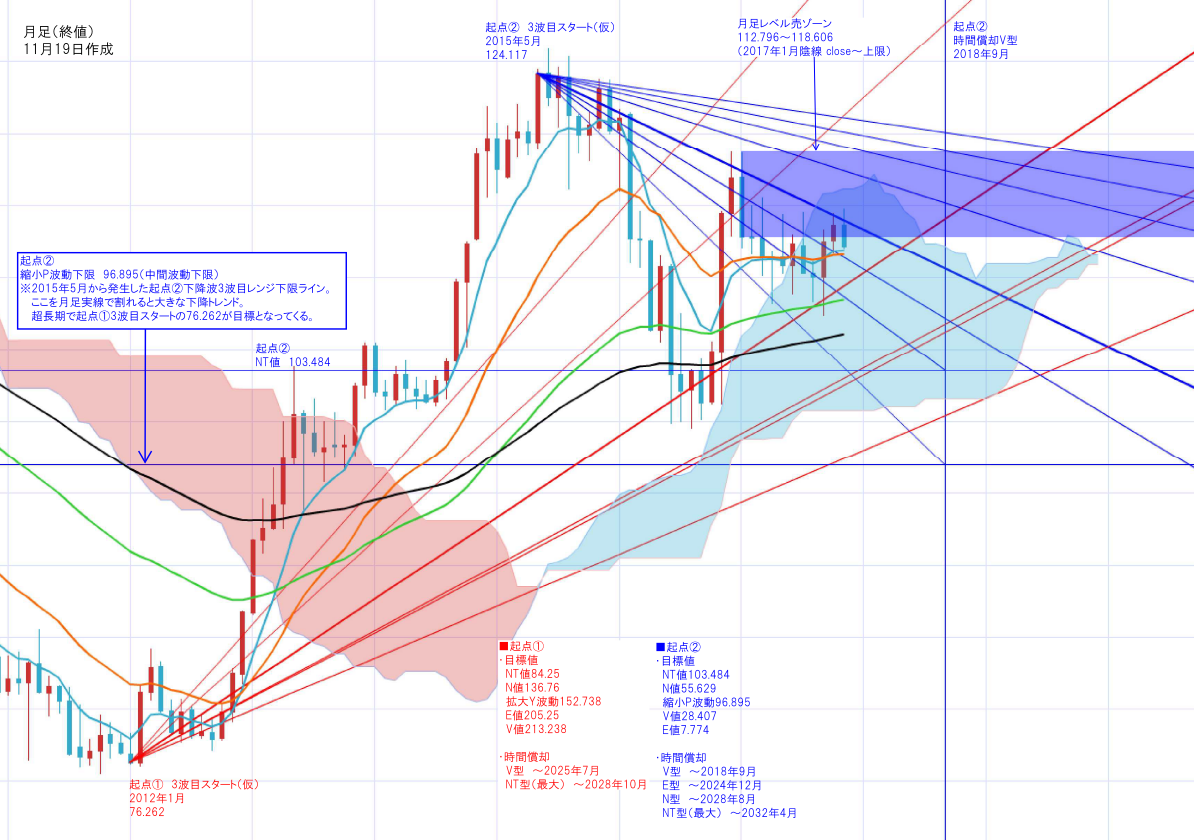
After hitting the line at the beginning of the month (N-N), the rate has continued to decline under control.
Since the lower band is coming in on the lower downward reach line, we will watch whether the rate moves to this line in November.
The November rate at the lower downward reach line is around 111.3.
In front, the short-term EMA (8) is 111.8, the short-term EMA (21) is 111.5
If there is a large decline, the upward reach line will provide support
The November rate at the upward reach line is around 109.3.
In the fourth week, we will examine the details on the weekly and daily charts.


