

Use of the "Visualization Indicator" (Part 19)
“Visualization Indicator” usage (part19)”
In the previous post,
11月19日 Friday, crude oil prices plummeted. The crude oil futures price fell to about1 1 and a half months, to1 barrel = 75 dollars.
As I wrote, however, oil prices have continued to decline further.
So, I graphed last weekend’s movements using the “8CFD Visualization Indicator.” The upper half shows the U.S. stock indicesS&P500, and the lower half shows the “8CFD Visualization Indicator,” depicting stock indices and crude oil futures prices.
Oil is drawn with the orange thick line.
The chart is in 5-minute intervals, for the period from5 minutes,11月25日 to11月26日.
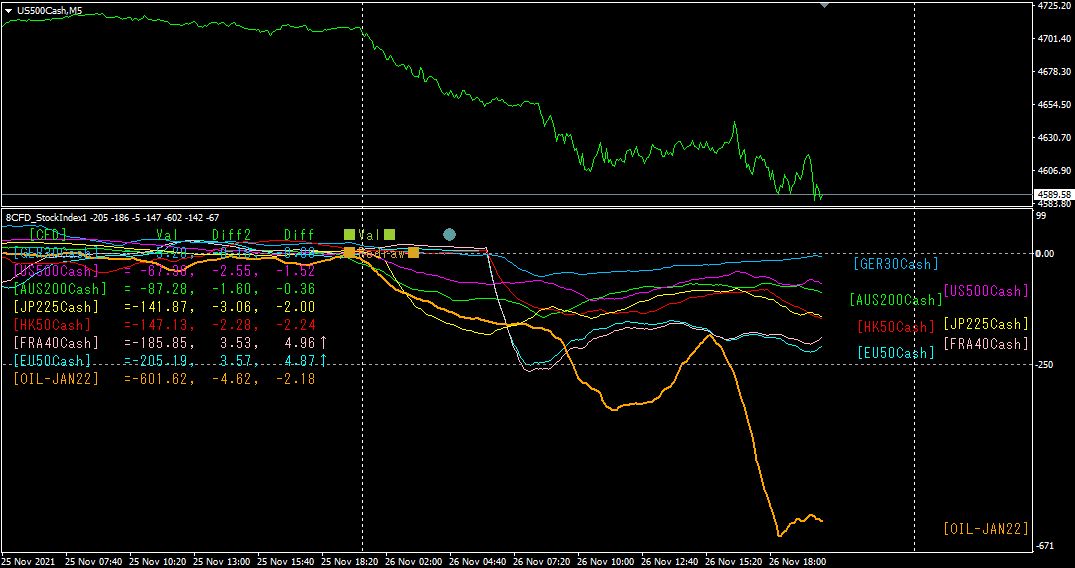
The movement that started first wasAUS200(Australia 200 index) (green), followed byJP225(yellow), thenFRA40(France Stock Index40)(pink) andEU50(Euro Stoxx50 index)(light blue).
The time lag in movements is due to different market opening times. First the Oceania market moves, then the Tokyo market, and in the afternoon the European markets begin to move.
Looking at the movements in these graphs, another trading strategy can be contemplated.
(1)Monitor sharp movements in oil prices.
(2)Check stock indices in the Oceania and Tokyo markets.
(3)From the above (1) and (2), if the direction of movement is clear, place trades before the European market opens.
In this case, on the morning of November 25, we will place a sell order on the “France Stock Index 40.” The “France Stock Index 40” closed at 7078 euros on November 25. When European markets opened, the initial price opened with a large gap at 6923 euros. Subsequently it fell to 6703 euros, down by 220 euros.
If one euro is worth 128 yen, that is a drop of 28,000 yen.
★★★Notice
services were changed, and the blog ended on2021 year month day.
Until now, the content written as the blog “28 Currency Pairs Indicator - Verification” (issues #1–#55) will be consolidated into this “Investment Navi+.” The title will continue to be the same as before, “Visualization Indicator Usage,” but the article content will cover verifications of the “28 Currency Pairs Indicator” series as well.
Thank you for your continued support.
<参考>
“28 Currency Pairs Indicator” series?
(1) 28 Currency pair trend strength is listed numerically in the “28 Currency Pair List Indicator.”
(2) 8 Currency pair movements are drawn graphically in the “8CP Visualization Indicator.”
version,London version,New York version,Any_CFD version of4 types.
(3) 28 Currency pairsBB_Bandwalk Indicator
BandWalk of Bollinger Bands and expansion/contraction display and sorting feature in the indicator
【Items I have for sale】https://www.gogojungle.co.jp/users/140198/products


