

Why is it difficult to get results when using RCI on multiple timeframes?
※Because the blog will be closed, some articles will be moved to Investing Navigation Plus.
RCI, especially 3 booksRCI are used by many people who narrow entries using multiple timeframes.
When you think that the same direction is showing in multiple charts, it might be natural to think that betting in that direction would make you win more easily.
However, there is a catch.
With price action-based logic, the effectiveness of multi-timeframe checking can be positive in many cases, but it often does not work well with oscillator-based approaches.
In other words, trying to make oscillators or technical indicators that process price movement more precise across multiple timeframes is a method from about 15 years ago.
That is because, about 15 years ago, FX products that entered when lines like the direction of the stochastic aligned on 5 minutes, 15 minutes, and 30 minutes, or when averages aligned, were a huge hit for about 60,000 yen.
At that time I hadn't yet fully established the RCI method, so I purchased several for research, but after long backtesting, I realized almost none of them were profitable.
To be clear, with a lot of discretion, any method could be profitable.
However, if you try to enter systematically whenever the directions align, you really won't win.
So why is it that a logic that seems correct ends up being almost unusable or requires heavy discretion in practice?
The reason lies in the fact that oscillators have numeric limits, for example from -100 to +100.
And, for instance, if you decide that a trend will reverse only when it rises to +80 and then falls below +80 again, there are standard rules for when to expect a reversal, but such uniform rules are flawed.
Look at the image below. On the left is a 5-minute chart, on the right a 30-minute chart, both showing the same period.
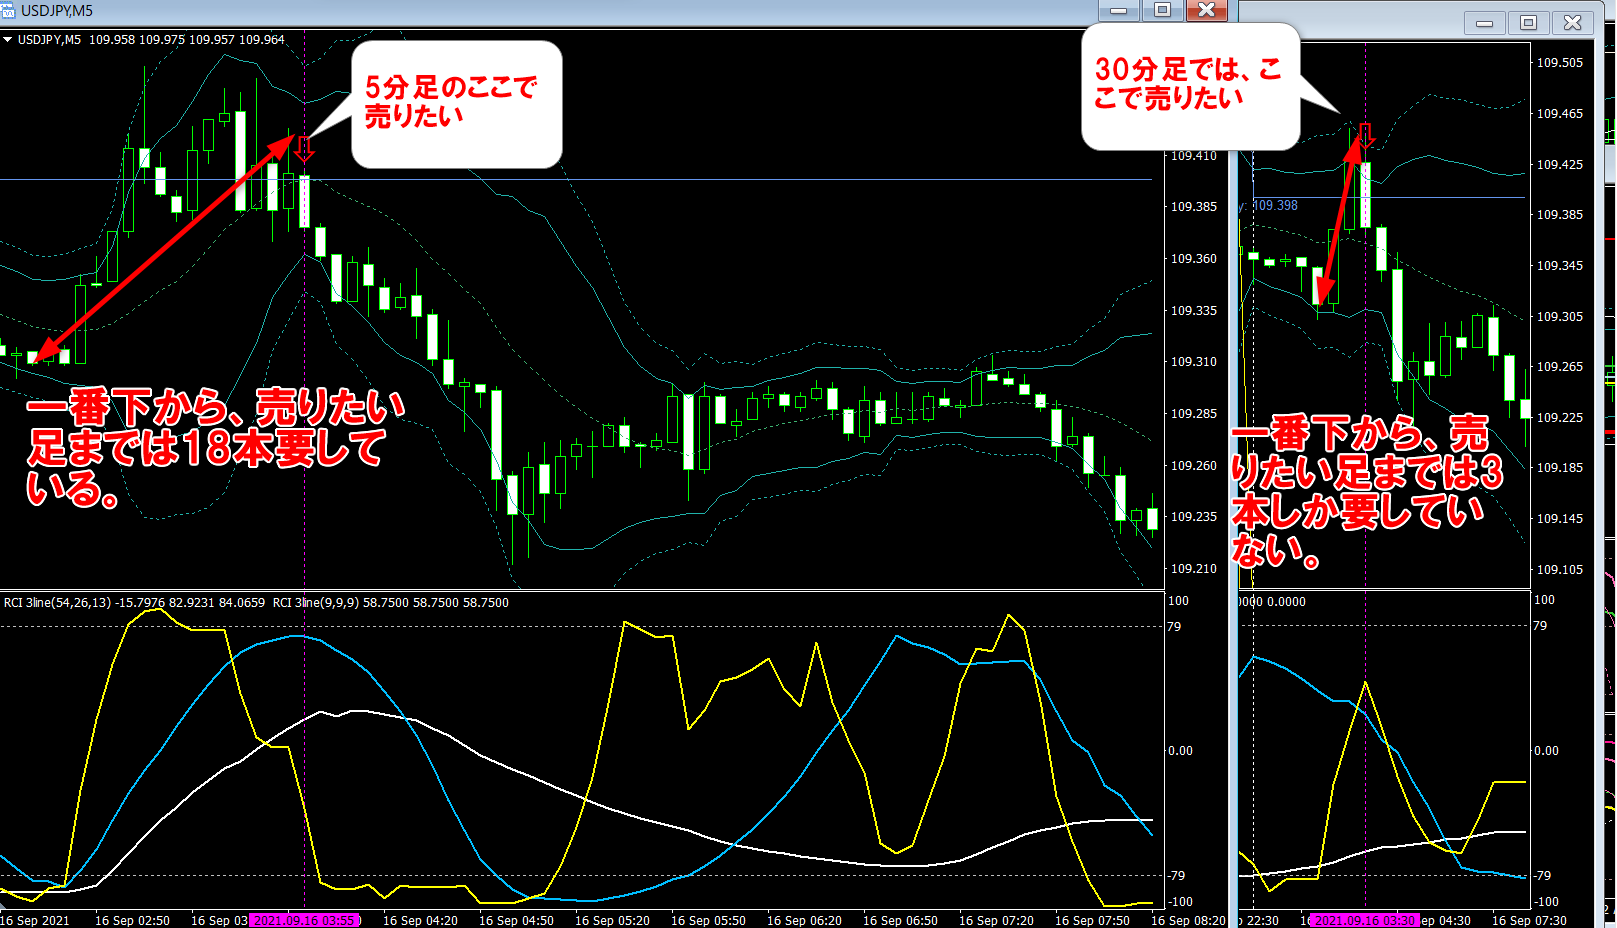
In both, once it reaches the blue D-Pivot, you can see that the market turns.D-Pivot indicates a reversal.
So, in the red-arrowed “selling” candles—the candles that would be profitable to sell—how many candles are required from the bottom?
minutes 18 candles, 30 minutes 3 candles, right?
In other words, on the 5-minute chart you’d want a sell signal after an 18-candle rise, whereas on the 30-minute chart you’d want a sell signal after a 3-candle rise (laughs).
If you use the same logic on both 5-minute and 30-minute charts, it would be absolutely impossible to satisfy these two desires.
Thus, because the number of candles required to reach a reversal point differs between timeframes, it is extremely difficult to generate consistent signals across multiple spans with a simple universal logic.
Did you understand?
However, to avoid misunderstanding again, multi-timeframe is not completely useless.
If you construct the logic with precision, it can become usable.
But in many cases, it requires discretion, leading to large individual differences, which is problematic.
If you are prepared to refine discretionary judgment thoroughly, using oscillators in multi-timeframes is excellent (laughs).
However, if you lack confidence in discretionary judgment, it is wiser to rely on a logic that can be executed systematically.
Are you going to master the power of discretion, or would you like to learn a systematic practical method?
For those of you who choose the latter,Max's proposed systematic trading is worth considering.
The ahead-of-time RCI is scheduled to start pre-sale on the night of September 26.
“”